Choose a Power BI model framework

Mohamad's interest is in Programming (Mobile, Web, Database and Machine Learning). He is studying at the Center For Artificial Intelligence Technology (CAIT), Universiti Kebangsaan Malaysia (UKM).
Describe model frameworks, their benefits and limitations, and features to help optimize your Power BI data models.
Learning objectives
By the end of this module, you’ll be able to:
Describe Power BI model fundamentals.
Determine when to develop an import model.
Determine when to develop a DirectQuery model.
Determine when to develop a composite model.
Choose an appropriate Power BI model framework.
[1] Introduction
For over two decades, Microsoft continues to make deep investments in enterprise business intelligence (BI). Azure Analysis Services (AAS) and SQL Server Analysis Services (SSAS) are based on mature BI data modeling technology used by countless enterprises. The same technology is also at the heart of Power BI data models.
Power BI offers you a choice when designing your model. You can use Power BI Desktop to develop your model, and you can develop it by using different frameworks. These frameworks help to deliver fast performance, near real-time results, or both.
This module introduces the frameworks, their benefits and limitations, and features to help optimize your models. Lastly, it provides you with guidance to help you choose the right framework and features for your project.
[2] Describe Power BI model fundamentals
This unit introduces Power BI model terms. It’s important that you understand these terms in order to choose the appropriate model framework for your project. This unit describes the following terms:
Data model
Power BI dataset
Analytic query
Tabular model
Star schema design
Table storage mode
Model framework
Data model
A Power BI data model is a query-able data resource that’s optimized for analytics. Reports can query data models by using one of two analytic languages: Data Analysis Expressions (DAX) or Multidimensional Expressions (MDX). Power BI uses DAX, while paginated reports can use either DAX or MDX. The Analyze in Excel features uses MDX.
Tip
A data model is also described as semantic model, especially in enterprise scenarios. Commonly, in the context of a data discussion and in this module, a data model is simply referred to as a model.
Power BI dataset
You develop a Power BI model in Power BI Desktop, and once published to a workspace in the Power BI service, it’s then known as a dataset. A dataset is a Power BI artifact that’s a source of data for visualizations in Power BI reports and dashboards.
Note
Not all datasets originate from models developed in Power BI Desktop. Some datasets represent connections to external-hosted models in AAS or SSAS. Others can represent real-time data structures, including push datasets, streaming datasets, or hybrid datasets. This module is concerned only with models developed in Power BI Desktop.
Analytic query
Power BI reports and dashboards must query a dataset. When Power BI visualizes dataset data, it prepares and sends an analytic query. An analytic query produces a query result from a model that’s easy for a person to understand, especially when visualized.
An analytic query has three phases that are executed in this order:
Filter
Group
Summarize
Filtering (sometimes known as slicing) narrows down on a subset of the model data. Filter values aren’t visible in the query result. Most analytic queries apply filters because it’s common to filter by a time period, and usually other attributes. Filtering happens in different ways. In a Power BI report, you can set filters at report, page, or visual level. Report layouts often include slicer visuals to filter visuals on the report page. When the model enforces row-level security (RLS), it applies filters to model tables to restrict access to specific data. Measures, which summarize model data, can also apply filters.
Grouping (sometimes known as dicing) divides query result into groups. Each group is also a filter, but unlike the filtering phase, filter values are visible in the query result. For example, grouping by customer filters each group by customer.
Summarization produces a single value result. Typically, a report visual summarizes a numeric field by using an aggregate function. Aggregate functions include sum, count, minimum, maximum, and others. You can achieve simple summarization by aggregating a column, or you can achieve complex summarization by creating a measure using a DAX formula.
Consider an example: A Power BI report page includes a slicer to filter by a single year. There’s also a column chart visual that shows quarterly sales for the filtered year.
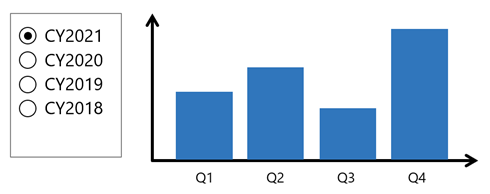
In this example, the slicer filters the visual by calendar year 2021. The column chart groups by quarters (of the filtered year). Each column is a group that represents a visible filter. The column heights represent the summarized sales values for each quarter of the filtered year.
Tabular model
A Power BI model is a tabular model. A tabular model comprises one or more tables of columns. It can also include relationships, hierarchies, and calculations.
Star schema design
To produce an optimized and easy-to-use tabular model, we recommend you produce a star schema design. Star schema design is a mature modeling approach widely adopted by relational data warehouses. It requires you to classify model tables as either dimension or fact.
Dimension tables describe business entities; the things you model. Entities can include products, people, places, and concepts including time itself. Fact tables store observations or events, and can be, for example, sales orders, stock balances, exchange rates, or temperature readings. A fact table contains dimension key columns that relate to dimension tables, and numeric measure columns. A fact table forms the center of a star, and the related dimension tables form the points of the star.
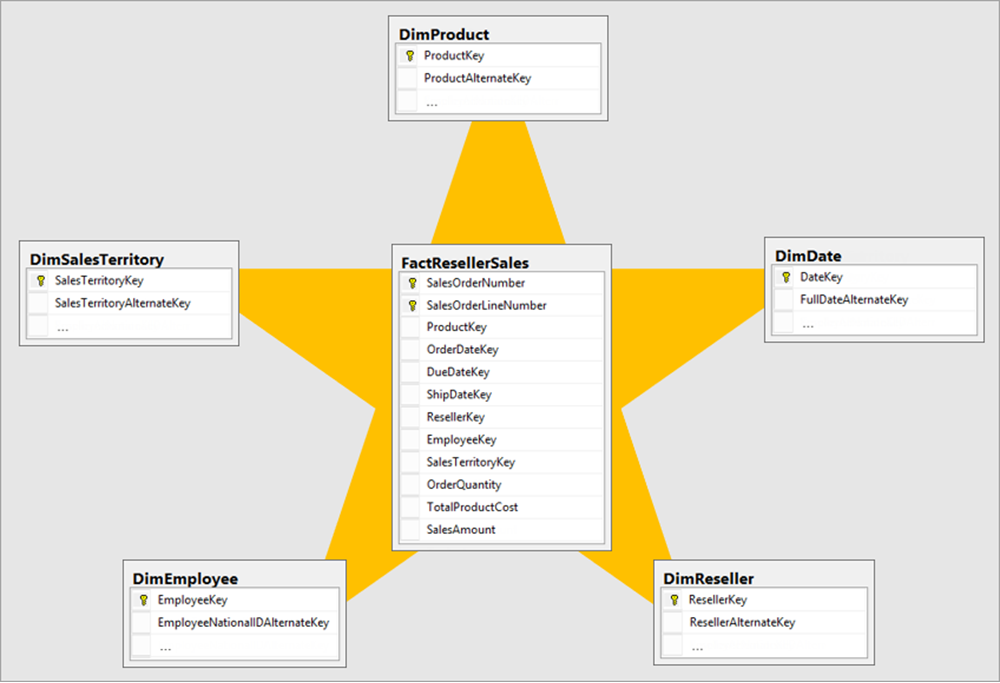
In an analytic query, dimensions table columns filter or group. Fact table columns are summarized.
For more information, see Understand star schema and the importance for Power BI.
Table storage mode
Each Power BI model table (except calculated tables) has a storage mode property. The storage mode property can be either Import, DirectQuery, or Dual, and it determines whether table data is stored in the model.
Import – Queries retrieve data that’s stored, or cached, in the model.
DirectQuery – Queries pass through to the data source.
Dual – Queries retrieve stored data or pass through to the data source. Power BI determines the most efficient plan, striving to use cached data whenever possible.
Model framework
Table storage mode settings determine the model framework, which can be either import, DirectQuery, or composite. The following units in this module describe each of these frameworks and provides guidance on their use.
An import model comprises tables that have their storage mode property set to Import.
A DirectQuery model comprises tables that have their storage mode property set to DirectQuery, and they belong to the same source group. Source group is described later in this module.
A composite model comprises more than one source group.
[3] Determine when to develop an import model
An import model comprises tables that have their storage mode property set to Import. It includes calculated tables, which you define with a DAX formula, too.
Import model benefits
Import models are the most frequently developed model framework because there are many benefits. Import models:
Support all Power BI data source types, including databases, files, feeds, web pages, dataflows, and more.
Can integrate source data. For example, one table sources its data from a relational database while a related table sources its data from a web page.
Support all DAX and Power Query (M) functionality.
Support calculated tables.
Deliver the best query performance. That’s because the data cached in the model is optimized for analytic queries (filter, group, and summarize) and the model is stored entirely in memory.
In short, import models offer you the most options and design flexibility, and they deliver fast performance. For this reason, Power BI Desktop defaults to use import storage mode when you “Get data.”

Import model limitations
Despite the many compelling benefits, there are limitations of import models that you must bear in mind. Limitations are related to model size and data refresh.
Model size
Power BI imposes dataset size restrictions, which limit the size of a model. When you publish the model to a shared capacity, there’s a 1-GB limit per dataset. When this size limit is exceeded, the dataset will fail to refresh. When you publish the model to a dedicated capacity (also known as Premium capacities), it can grow beyond 10-GB, providing you enable the Large dataset storage format setting for the capacity.
You should always strive to reduce the amount of data stored in tables. This strategy helps to reduce the duration of model refreshes and speed up model queries. There are numerous data reduction techniques that you can apply, including:
Remove unnecessary columns
Remove unnecessary rows
Group by and summarize to raise the grain of fact tables
Optimize column data types with a preference for numeric data
Preference for custom columns in Power Query instead of calculated columns in the model
Disable Power Query query load
Disable auto date/time
Use DirectQuery table storage, as described in later units of this module.
For more information, see Data reduction techniques for Import modeling.
Note
The 1-GB per dataset limit refers to the compressed size of the Power BI model, not the volume of data being collected from the source system.
Data refresh
Imported data must be periodically refreshed. Dataset data is only as current as the last successful data refresh. To keep data current, you set up scheduled data refresh, or report consumers can perform an on-demand refresh.
Power BI imposes limits on how often scheduled refresh operations can occur. It’s up to eight times per day in a shared capacity, and up to 48 times per day in a dedicated capacity.
You should determine whether this degree of latency is tolerable. It often depends on the velocity (or volatility) of the data, and the urgency to keep users informed about the current state of data. When scheduled refresh limits aren’t acceptable, consider using DirectQuery storage tables, or creating a hybrid table. Or take a different approach, and create a real-time dataset instead.
Tip
Hybrid tables are described in unit 4. For information about real-time datasets, work through the Monitor data in real-time with Power BI module.
You must also consider refresh workload and duration. By default, to refresh a table, Power BI removes all data and reloads it again. These operations can place an unacceptable burden on source systems, especially for large fact tables. To reduce this burden, you can set up the incremental refresh feature. Incremental refresh automates the creation and management of time-period partitions, and intelligently update only those partitions that require refresh.
When your data source supports incremental refresh, it can result in faster and more reliable refreshes, and reduced resource consumption of Power BI and source systems.
Advanced data modelers can customize their own partitioning strategy. Automation scripts can create, manage, and refresh table partitions. For more information, see Power BI usage scenarios: Advanced data model management. This usage scenario describes using the XMLA endpoint available with Power BI Premium.
[4] Determine when to develop a DirectQuery model
A DirectQuery model comprises tables that have their storage mode property set to DirectQuery, and they belong to the same source group.
A source group is a set of model tables that relate to a data source. There are two types:
Import – Represents all import storage mode tables including calculated tables. There can only be one import source group in a model.
DirectQuery – Represents all DirectQuery storage mode tables that relate to a specific data source.
Note
An import model and a DirectQuery model only comprise a single source group. When there’s more than one source group, the model framework is known as a composite model. Composite models are described in Unit 5.
DirectQuery model benefits
There are several benefits to developing a DirectQuery model.
Model large or fast-changing data sources
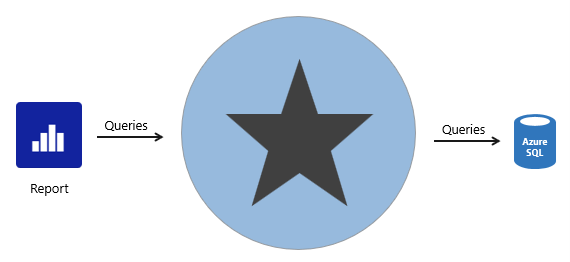
A DirectQuery model is a great framework choice when your source data exhibits volume and/or velocity characteristics. Because DirectQuery tables don’t require refresh, they’re well suited to large data stores, like a data warehouse. It’s impractical and inefficient, if not impossible, to import an entire data warehouse into a model. When the source data changes rapidly and users need to see current data, a DirectQuery model can deliver near real-time query results.
When a report queries a DirectQuery model, Power BI passes those queries to the underlying data source.
Enforce source RLS
DirectQuery is also useful when the source database enforces row-level security (RLS). Instead of replicating RLS rules in your Power BI model, the source data base can enforce its rules. This approach works only for some relational databases, and it involves setting up single sign-on for the dataset data source. For more information, see Azure SQL Database with DirectQuery.
Data sovereignty restrictions
If your organization has security policies that restrict data leaving their premises, then it isn’t possible to import data. A DirectQuery model that connects to an on-premises data source may be appropriate. (You can also consider installing Power BI Report Server for on-premises reporting.)
Create specialized datasets
Typically, DirectQuery mode supports relational database sources. That’s because Power BI must translate analytic queries to native queries understood by the data source.
However, there’s one powerful exception. You can connect to a Power BI dataset (or Azure Analysis Services model) and convert it to a DirectQuery local model. A local model is a relative term that describes a model’s relationship to another model. In this case, the original dataset is a remote model, and the new dataset is the local model. These models are chained, which is term used to describe related models. You can chain up to three models in this way.
This capability to chain models supports the potential to personalize and/or extend a remote model. The simplest thing you can do is rename objects, like tables or columns, or add measures to the local model. You can also extend the model with calculated columns or calculated tables, or add new import or DirectQuery tables. However, these extensions result in the creation of new source groups, which means the model becomes a composite model. That scenario is described in Unit 5.
For more information, see Using DirectQuery for Power BI datasets and Azure Analysis Services.
DirectQuery model limitations
There are many limitations related to DirectQuery models that you must bear in mind. Here are the main limitations:
Not all data sources are supported. Typically, only major relational database systems are supported. Power BI datasets and Azure Analysis Services models are supported too.
All Power Query (M) transformations are not possible, because these queries must translate to native queries that are understood by source systems. So, for example, it’s not possible to use pivot or unpivot transformations.
Analytic query performance can be slow, especially if source systems aren’t optimized (with indexes or materialized views), or there are insufficient resources for the analytic workload.
Analytic queries can impact on source system performance. It could result in a slower experience for all workloads, including OLTP operations.
Boost DirectQuery model performance
When there’s a justification to develop a DirectQuery model, you can mitigate some limitations in two ways.
Data source optimizations
You can optimize the source database to ensure the expected analytic query workload performs well. Specifically, you can create indexes and materialized views, and ensure the database has sufficient resources for all workloads.
Tip
We recommend that you always work in collaboration with the database owner. It’s important that they understand the additional workload a DirectQuery model can place on their database.
DirectQuery user-defined aggregation tables
You can add user-defined aggregation tables to a DirectQuery model. User-defined aggregation tables are special model tables that are hidden (from users, calculations, and RLS). They work best when they satisfy higher-grain analytic queries over large fact tables. When you set the aggregation table to use DirectQuery storage mode, it can query a materialized view in the data source. You can also set an aggregation table to use import storage mode or enable automatic aggregations, and these options are described in Unit 4.
For more information, see DirectQuery model guidance in Power BI Desktop.
[5] Determine when to develop a composite model
A composite model comprises more than one source group. Typically, there’s always the import source group and a DirectQuery source group.

Note
Generally, the benefits and limitations associated with import and DirectQuery storage modes apply to composite models.
Composite model benefits
There are several benefits to developing a composite model.
Composite models provide you with design flexibility. You can choose to integrate data using different storage modes, striking the right balance between imported data and pass-through data. Commonly, enterprise models benefit from using DirectQuery tables on large data sources and by boosting query performance with imported tables. Power BI features that support this scenario are described later in this unit.
Composite models can also boost the performance of a DirectQuery model by providing Power BI with opportunity to satisfy some analytic queries from imported data. Querying cached data almost always performs better than pass-through queries.
Lastly, when your model includes DirectQuery tables to a remote model, like a Power BI dataset, you can extend your model with new calculated columns and tables. It results in a specialized model based on a core model. For more information, see Power BI usage scenarios: Customizable managed self-service BI.
Composite model limitations
There are several limitations related to composite models.
Import (or dual, as described later) storage mode tables still require periodic refresh. Imported data can become out of sync with DirectQuery sourced data, so it’s important to refresh it periodically.
When an analytic query must combine imported and DirectQuery data, Power BI must consolidate source group query results, which can impact performance. To help avoid this situation for higher-grain queries, you can add import aggregation tables to your model (or enable automatic aggregations) and set related dimension tables to use dual storage mode. This scenario is described later in this unit.
When chaining models (DirectQuery to Power BI datasets), modifications made to upstream models can break downstream models. Be sure to assess the impact of modifications by performing dataset impact analysis first.
Relationships between tables from different source groups are known as limited relationships. A model relationship is considered limited when there's no guaranteed "one" side (The "one" side means the column contains unique values; the "many" side means the column can contain duplicate values.) This can occur in two situations. The first is when the relationship uses a many-to-many cardinality type, even if one or both columns contain unique values. The second is when the relationship spans different source groups, which only happens in composite models. Limited relationships may result in different evaluations of model queries and calculations. For more information, see Relationship evaluation.
Boost DirectQuery model performance with import data
When there’s a justification to develop a DirectQuery model, you can mitigate some limitations by using specific Power BI features that involve import tables.
Import aggregation tables
You can add import storage mode user-defined aggregation tables or enable automatic aggregations. This way, Power BI directs higher-grain fact queries to a cached aggregation. To boost query performance further, ensure that related dimension tables are set to use dual storage mode.
Automatic aggregations are a Premium feature. For more information, see Automatic aggregations.
Dual storage mode
A dual storage mode table is set to use both import and DirectQuery storage modes. At query time, Power BI determines the most efficient mode to use. Whenever possible, Power BI attempts to satisfy analytic queries by using cached data.
Dual storage mode tables work well with import aggregation tables. They allow Power BI to satisfy higher-grain queries entirely from cached data.
Slicer visuals and filter card lists, which are often based on dimension table columns, render more quickly because they’re queried from cached data.
Deliver real-time data from an import model
When you set up an import table with incremental refresh, you can enable the Get the latest data in real-time with DirectQuery option.

By enabling this option, Power BI automatically creates a table partition that uses DirectQuery storage mode. In this case, the table becomes a hybrid table, meaning it has import partitions to store older data, and a single DirectQuery partition for current data.
When Power BI queries a hybrid table, the query uses the cache for older data, and passes through to the data source to retrieve current data.
This option is only available with a Premium license.
For more information, see Configure incremental refresh and real-time data.
[6] Choose a model framework
Here’s some general guidance about choosing the appropriate model framework for your project. It especially applies to enterprise solutions, where data volumes are large, query throughput is high, and fast responsiveness is important.
Most importantly, choose the import model framework whenever possible. This framework offers you the most options, design flexibility, and delivers fast performance. Be sure to apply data reduction techniques to ensure that Power BI loads the least amount of data possible.
Choose the DirectQuery model framework when your data source stores large volumes of data and/or your report needs to deliver near real-time data.
Choose the composite model framework to:
Boost the query performance of a DirectQuery model.
Deliver near real-time query results from an import model.
Extend a Power BI dataset (or AAS model) with additional data.
You can boost the query performance of a DirectQuery model by using aggregation tables, which can use import or DirectQuery storage mode. When using import aggregation tables, be sure to set related dimension tables to use dual storage mode. That way, Power BI can satisfy higher-grain queries entirely from cache.
You can deliver near real-time query results from in import model by creating a hybrid table. In this case, Power BI adds a DirectQuery partition for the current period.
Lastly, you can create specialized models by chaining to a core model by using DirectQuery. This type of development is typically done by a business analyst who extends core models, which IT delivers and supports.
Important
Plan carefully. In Power BI Desktop, it’s always possible to convert a DirectQuery table to an import table. But it’s not possible to convert an import table to a DirectQuery table.
[7] Module assessment
Choose the best response for each of the questions below.
Check your knowledge
[1] Geoffrey is a data modeler at Adventure Works who developed a DirectQuery model that connects to the data warehouse. To improve the query performance of higher-grain sales queries, Geoffrey added an import aggregation table. What else should Geoffrey do to improve query performance of the higher-grain queries?
a. Set related dimension tables as aggregation tables.
b. Set related dimension tables to dual storage mode.
c. Set related dimension tables to import storage mode.
[2] Breana is a data modeler at Adventure Works who developed a manufacturing model, which is an import model. Breana needs to ensure that manufacturing reports deliver real-time results. Which type of table should Breana create?
a. Aggregation table.
b. Hybrid table.
c. Partitioned table.
[3] Mousef is a business analyst at Adventure Works who wants to create a new model by extending the sales dataset, which is delivered by IT. Mousef wants to add a new table of census population data sourced from a web page. Which model framework should Mousef use?
a. Composite.
b. DirectQuery.
c. Live connection.
[8] Summary
You can develop your Power BI model based on three different frameworks: import, DirectQuery, and composite. Each framework has its own benefits and limitations, and features to help you optimize your model.
Ultimately, you should strive to develop a model that efficiently delivers fast performance with low latency, even for high volume data sources.
Source:
https://learn.microsoft.com/en-us/training/modules/choose-power-bi-model-framework/