Get data in Power BI

Mohamad's interest is in Programming (Mobile, Web, Database and Machine Learning). He is studying at the Center For Artificial Intelligence Technology (CAIT), Universiti Kebangsaan Malaysia (UKM).
You'll learn how to retrieve data from a variety of data sources, including Microsoft Excel, relational databases, and NoSQL data stores. You'll also learn how to improve performance while retrieving data.
Learning objectives
By the end of this module, you'll be able to:
Identify and connect to a data source
Get data from a relational database, like Microsoft SQL Server
Get data from a file, like Microsoft Excel
Get data from applications
Get data from Azure Analysis Services
Select a storage mode
Fix performance issues
Resolve data import errors
[1] Introduction
Let's say that you work for a company where you're required to build Microsoft Power BI reports. The data can reside in several different databases and files. These data repositories are different from each other, some are in Microsoft SQL Server, some are in Microsoft Excel, but all the data is related.
Note
The module sections prior to the lab are purely informational. You will be given the opportunity to work with real data during the lab.
In this module’s scenario, you work for Tailwind Traders. You’ve been tasked by senior leadership to create a suite of reports that are dependent on data in several different locations. The database that tracks sales transactions is in SQL Server, a relational database that contains what items each customer bought and when. It also tracks which employee made the sale, along with the employee name and employee ID. However, that database doesn’t contain the employee’s hire date, their title, or who their manager is. For that information, you need to access files that Human Resources keeps in Excel. You've been consistently requesting that they use an SQL database, but they haven't yet had the chance to implement it.
When an item ships, the shipment is recorded in the warehousing application, which is new to the company. The developers chose to store data in Cosmos DB, as a set of JSON documents.
Tailwind Traders has an application that helps with financial projections, so that they can predict what their sales will be in future months and years, based on past trends. Those projections are stored in Microsoft Azure Analysis Services. Here’s a view of the many data sources you're asked to combine data from.

Before you can create reports, you must first extract data from the various data sources. Interacting with SQL Server is different from Excel, so you should learn the nuances of both systems. After gaining understanding of the systems, you can use Power Query to help you clean the data, such as renaming columns, replacing values, removing errors, and combining query results. Power Query is also available in Excel. After the data has been cleaned and organized, you're ready to build reports in Power BI. Finally, you'll publish your combined semantic model and reports to Power BI service. From there, other people can use your semantic model and build their own reports or they can use the reports you’ve already built. Additionally, if someone else built a semantic model you'd like to use, you can build reports from that too!
This module will focus on the first step of getting the data from the different data sources and importing it into Power BI by using Power Query.
By the end of this module, you’ll be able to:
Identify and connect to a data source
Get data from a relational database, such as Microsoft SQL Server
Get data from a file, such as Microsoft Excel
Get data from applications
Get data from Azure Analysis Services
Select a storage mode
Fix performance issues
Resolve data import errors
[2] Get data from files
Organizations often export and store data in files. One possible file format is a flat file. A flat file is a type of file that has only one data table and every row of data is in the same structure. The file doesn't contain hierarchies. Likely, you're familiar with the most common types of flat files, which are comma-separated values (.csv) files, delimited text (.txt) files, and fixed width files. Another type of file would be the output files from different applications, like Microsoft Excel workbooks (.xlsx).

Power BI Desktop allows you to get data from many types of files. You can find a list of the available options when you use the Get data feature in Power BI Desktop. The following sections explain how you can import data from an Excel file that is stored on a local computer.
Scenario
The Human Resources (HR) team at Tailwind Traders has prepared a flat file that contains some of your organization's employee data, such as employee name, hire date, position, and manager. They've requested that you build Power BI reports by using this data, and data that is located in several other data sources.
Flat file location
The first step is to determine which file location you want to use to export and store your data.
Your Excel files might exist in one of the following locations:
Local - You can import data from a local file into Power BI. The file isn't moved into Power BI, and a link doesn't remain to it. Instead, a new semantic model is created in Power BI, and data from the Excel file is loaded into it. Accordingly, changes to the original Excel file aren't reflected in your Power BI semantic model. You can use local data import for data that doesn't change.
OneDrive for Business - You can pull data from OneDrive for Business into Power BI. This method is effective in keeping an Excel file and your semantic model, reports, and dashboards in Power BI synchronized. Power BI connects regularly to your file on OneDrive. If any changes are found, your semantic model, reports, and dashboards are automatically updated in Power BI.
OneDrive - Personal - You can use data from files on a personal OneDrive account, and get many of the same benefits that you would with OneDrive for Business. However, you'll need to sign in with your personal OneDrive account, and select the Keep me signed in option. Check with your system administrator to determine whether this type of connection is allowed in your organization.
SharePoint - Team Sites - Saving your Power BI Desktop files to SharePoint Team Sites is similar to saving to OneDrive for Business. The main difference is how you connect to the file from Power BI. You can specify a URL or connect to the root folder.
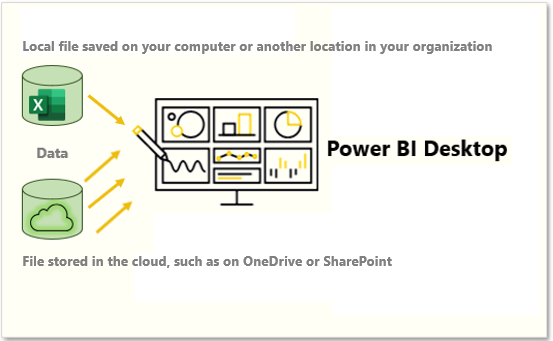

Using a cloud option such as OneDrive or SharePoint Team Sites is the most effective way to keep your file and your semantic model, reports, and dashboards in Power BI in-sync. However, if your data doesn't change regularly, saving files on a local computer is a suitable option.
Connect to data in a file
In Power BI, on the Home tab, select Get data. In the list that displays, select the option that you require, such as Text/CSV or XML. For this example, you'll select Excel.
Tip
The Home tab contains quick access data source options, such as Excel, next to the Get data button.

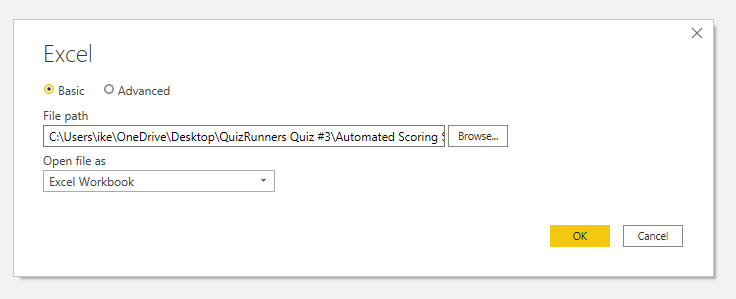
Depending on your selection, you need to find and open your data source. You might be prompted to sign into a service, such as OneDrive, to authenticate your request. In this example, you'll open the Employee Data Excel workbook that is stored on the Desktop (Remember, no files are provided for practice, these are hypothetical steps).

Select the file data to import
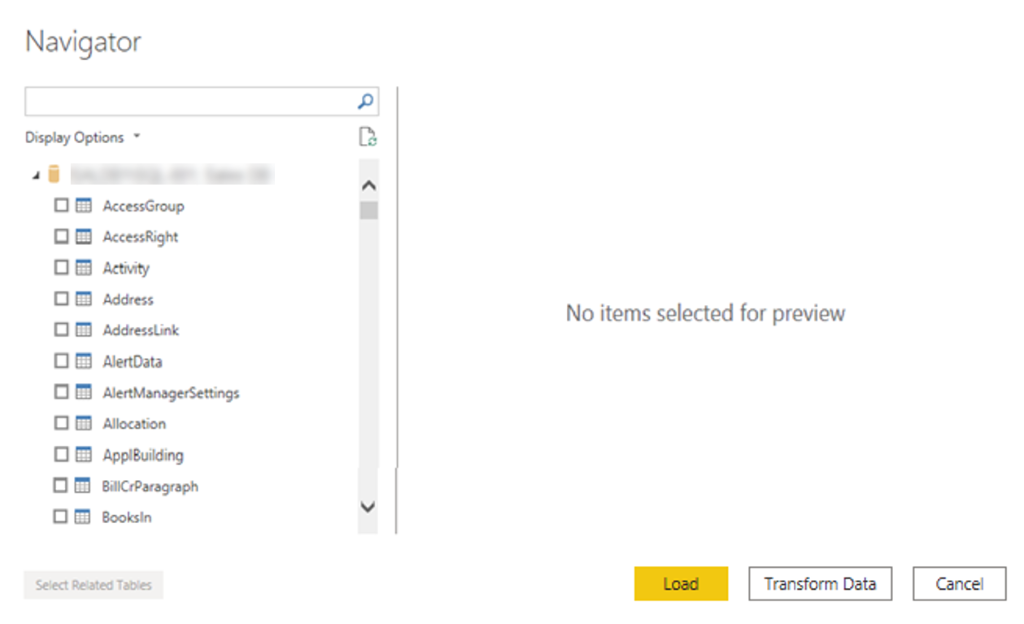
After the file has connected to Power BI Desktop, the Navigator window opens. This window shows you the data that is available in your data source (the Excel file in this example). You can select a table or entity to preview its contents, to ensure that the correct data is loaded into the Power BI model.
Select the check box(es) of the table(s) that you want to bring in to Power BI. This selection activates the Load and Transform Data buttons as shown in the following image.

Now you can select the Load button to automatically load your data into the Power BI model or select the Transform Data button to launch the Power Query Editor, where you can review and clean your data before loading it into the Power BI model.
We often recommend that you transform data, but that process will be discussed later in this module. For this example, you can select Load.
Change the source file
You might have to change the location of a source file for a data source during development, or if a file storage location changes. To keep your reports up to date, you'll need to update your file connection paths in Power BI.
Power Query provides many ways for you to accomplish this task, so that you can make this type of change when needed.
Data source settings
Query settings
Advanced Editor
Warning
If you are changing a file path, make sure that you reconnect to the same file with the same file structure. Any structural changes to a file, such as deleting or renaming columns in the source file, will break the reporting model.
For example, try changing the data source file path in the data source settings. Select Data source settings in Power Query. In the Data source settings window, select your file and then select Change Source. Update the File path or use the Browse option to locate your file, select OK, and then select Close.

[3] Get data from relational data sources
If your organization uses a relational database for sales, you can use Power BI Desktop to connect directly to the database instead of using exported flat files.
Connecting Power BI to your database will help you to monitor the progress of your business and identify trends, so you can forecast sales figures, plan budgets and set performance indicators and targets. Power BI Desktop can connect to many relational databases that are either in the cloud or on-premises.
Scenario
The Sales team at Tailwind Traders has requested that you connect to the organization's on-premises SQL Server database and get the sales data into Power BI Desktop so you can build sales reports.

Connect to data in a relational database
You can use the Get data feature in Power BI Desktop and select the applicable option for your relational database. For this example, you would select the SQL Server option, as shown in the following screenshot.
Tip
Next to the Get Data button are quick access data source options, such as SQL Server.

Your next step is to enter your database server name and a database name in the SQL Server database window. The two options in data connectivity mode are: Import (selected by default, recommended) and DirectQuery. Mostly, you select Import. Other advanced options are also available in the SQL Server database window, but you can ignore them for now.

After you've added your server and database names, you'll be prompted to sign in with a username and password. You'll have three sign-in options:
Windows - Use your Windows account (Azure Active Directory credentials).
Database - Use your database credentials. For instance, SQL Server has its own sign-in and authentication system that is sometimes used. If the database administrator gave you a unique sign-in to the database, you might need to enter those credentials on the Database tab.
Microsoft account - Use your Microsoft account credentials. This option is often used for Azure services.
Select a sign-in option, enter your username and password, and then select Connect.

Select data to import
After the database has been connected to Power BI Desktop, the Navigator window displays the data that is available in your data source (the SQL database in this example). You can select a table or entity to preview its contents and make sure that the correct data will be loaded into the Power BI model.
Select the check box(es) of the table(s) that you want to bring in to Power BI Desktop, and then select either the Load or Transform Data option.
Load - Automatically load your data into a Power BI model in its current state.
Transform Data - Open your data in Microsoft Power Query, where you can perform actions such as deleting unnecessary rows or columns, grouping your data, removing errors, and many other data quality tasks.

Import data by writing an SQL query
Another way you can import data is to write an SQL query to specify only the tables and columns that you need.
To write your SQL query, on the SQL Server database window, enter your server and database names, and then select the arrow next to Advanced options to expand this section and view your options. In the SQL statement box, write your query statement, and then select OK. In this example, you'll use the Select SQL statement to load the ID, NAME and SALESAMOUNT columns from the SALES table.

Change data source settings
After you create a data source connection and load data into Power BI Desktop, you can return and change your connection settings at any time. This action is often required due to a security policy within the organization, for example, when the password needs to be updated every 90 days. You can change the data source, edit permissions or clear permissions.
On the Home tab, select Transform data, and then select the Data source settings option.

From the list of data sources that displays, select the data source that you want to update. Then, you can right-click that data source to view the available update options or you can use the update option buttons on the lower left of the window. Select the update option that you need, change the settings as required, and then apply your changes.

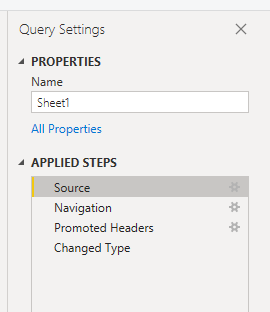
You can also change your data source settings from within Power Query. Select the table, and then select the Data source settings option on the Home ribbon. Alternatively, you can go to the Query Settings panel on the right side of the screen and select the settings icon next to Source (or double Select Source). In the window that displays, update the server and database details, and then select OK.

After you have made the changes, select Close and Apply to apply those changes to your data source settings.
Write an SQL statement
As previously mentioned, you can import data into your Power BI model by using an SQL query. SQL stands for Structured Query Language and is a standardized programming language that is used to manage relational databases and perform various data management operations.
Consider the scenario where your database has a large table that is comprised of sales data over several years. Sales data from 2009 isn't relevant to the report that you're creating. This situation is where SQL is beneficial because it allows you to load only the required set of data by specifying exact columns and rows in your SQL statement and then importing them into your semantic model. You can also join different tables, run specific calculations, create logical statements, and filter data in your SQL query.
The following example shows a simple query where the ID, NAME and SALESAMOUNT are selected from the SALES table.
The SQL query starts with a Select statement, which allows you to choose the specific fields that you want to pull from your database. In this example, you want to load the ID, NAME, and SALESAMOUNT columns.
SQLCopy
SELECT
ID
, NAME
, SALESAMOUNT
FROM
FROM specifies the name of the table that you want to pull the data from. In this case, it's the SALES table. The following example is the full SQL query:
SQLCopy
SELECT
ID
, NAME
, SALESAMOUNT
FROM
SALES
When using an SQL query to import data, try to avoid using the wildcard character (*) in your query. If you use the wildcard character (*) in your SELECT statement, you import all columns that you don't need from the specified table.
The following example shows the query using the wildcard character.
SQLCopy
SELECT *
FROM
SALES
The wildcard character (*) will import all columns within the Sales table. This method isn't recommended because it will lead to redundant data in your semantic model, which will cause performance issues and require extra steps to normalize your data for reporting.
All queries should also have a WHERE clause. This clause will filter the rows to pick only filtered records that you want. In this example, if you want to get recent sales data after January 1st, 2020, add a WHERE clause. The evolved query would look like the following example.
SQLCopy
SELECT
ID
, NAME
, SALESAMOUNT
FROM
SALES
WHERE
OrderDate >= ‘1/1/2020’
It's a best practice to avoid doing this directly in Power BI. Instead, consider writing a query like this in a view. A view is an object in a relational database, similar to a table. Views have rows and columns, and can contain almost every operator in the SQL language. If Power BI uses a view, when it retrieves data, it participates in query folding, a feature of Power Query. Query folding will be explained later, but in short, Power Query will optimize data retrieval according to how the data is being used later.
[4] Create dynamic reports with parameters
Dynamic reports are reports in which the data can be changed by a developer according to user specifications. Dynamic reports are valuable because a single report can be used for multiple purposes. If you use dynamic reports, you'll have fewer individual reports to create, which will save organizational time and resources.
You can use parameters by determining the values that you want to see data for in the report, and the report updates accordingly by filtering the data for you.
Creating dynamic reports allows you to give users more power over the data that is displayed in your reports; they can change the data source and filter the data by themselves.
In the following example, you've created a report for the Sales team at Tailwind Traders that displays the sales data in the SQL Server database. The report gives a holistic view of how the Sales team is performing. While the report is useful, the Sales team members want to be able to filter the report so that they can view their own data only and track their performance against their sales targets.
Create dynamic reports for individual values
To create a dynamic report, you first need to write your SQL query. Then use the Get data feature in Power BI Desktop to connect to the database.
In this example, you connect to your database on SQL Server by following these steps:
After you have entered your server details, in the SQL Server database window, select Advanced options.
Paste the SQL query into the SQL statement box and then select OK.


When the connection is made, the data is shown in the preview window.
Select Edit to open the data in Power Query Editor.


Next, you create the parameter by following these steps:
On the Home tab, select Manage parameters > New parameter.
On the Parameters window, change the default parameter name to something more descriptive so that its purpose is clear. In this case, you change the name to SalesPerson.
Select Text from the Type list and then select Any value from the Suggested value list.
Select OK.

A new query is shown for the parameter that you created.


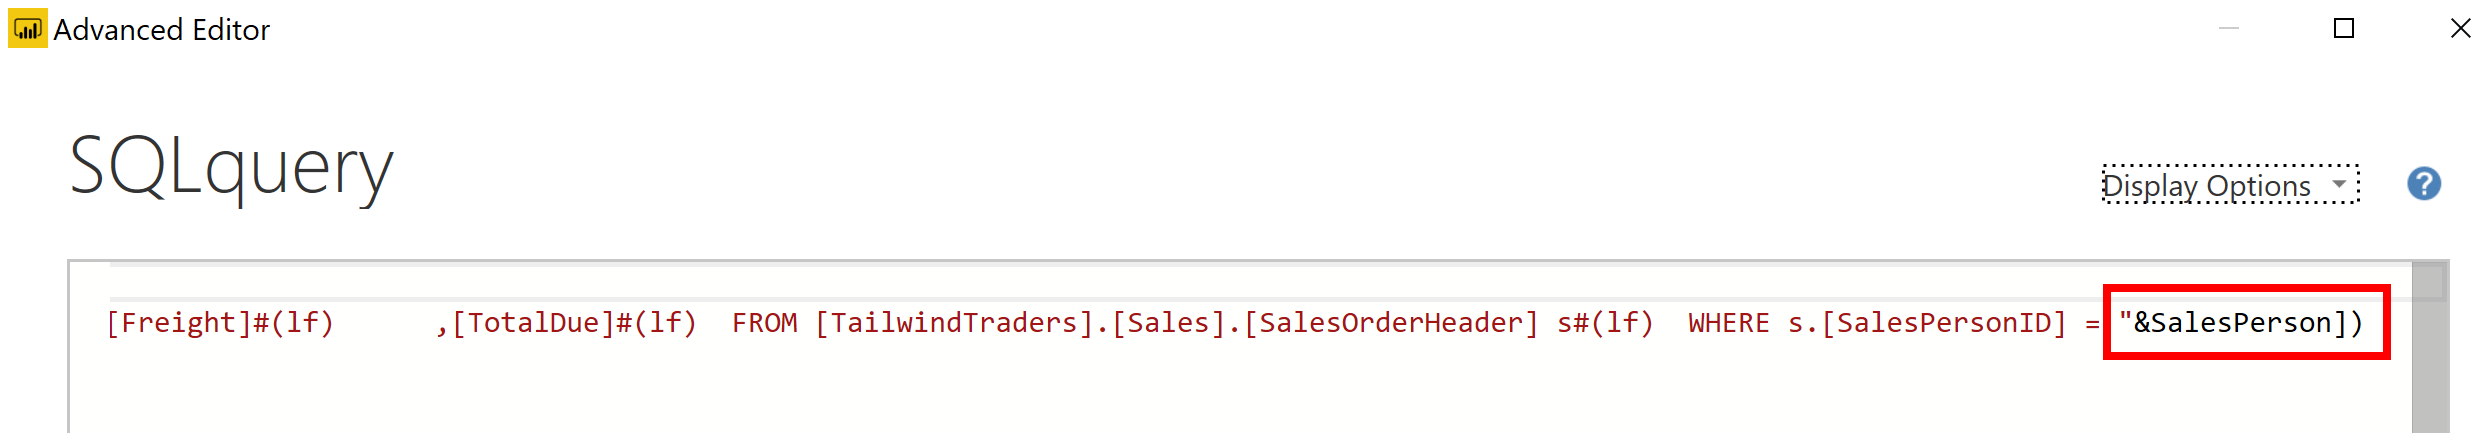
Now, you need to adjust the code in SQL query to assess your new parameter:
Right-click Query1 and then select Advanced editor.
Replace the existing value in the execute statement with an ampersand (&) followed by your parameter name (SalesPerson), as illustrated in the following image.
Make sure that no errors are shown at bottom of the window and then select Done.

Though you don't see a difference on the screen, Power BI ran the query.
To confirm that the query was run, you can run a test by selecting the parameter query and entering a new value in the Current Value box.

A warning icon might display next to the query. If so, select that query to view the warning message, which states that permission is required to run this native database query. Select Edit Permission and then select Run.
When the query runs successfully, the parameter displays the new value.

Select Close and Apply to return to the report editor.


Now, you can apply the parameter to the report:
Select Edit queries > Edit parameters.
On the Edit Parameters window, enter a new value and then select OK.
Select Apply changes and then run the native query again.
Now, when you view the data, you see the data for the new value that was passed through the parameter.


You can now create a report that displays data for one particular value at a time. More steps are needed to display data for multiple values at the same time.
Create dynamic reports for multiple values
To accommodate multiple values at a time, you first need to create a Microsoft Excel worksheet that has a table consisting of one column that contains the list of values.
Next, use the Get data feature in Power BI Desktop to connect to the data in that Excel worksheet, and then follow these steps:
On the Navigator window, select Edit to open the data in Power Query Editor, where you see a new query for the data table.

Rename the column in the table to something more descriptive.
Change the column data type to Text so that it matches the parameter type and you avoid data conversion problems.
In the query Properties section, change the name of the data source to something more descriptive. For this example, enter SalesPersonID.

Next, you need to create a function that passes the new SalesPersonID query into Query1:
Right-click Query1 and then select Create function.

Enter a name for the function and then select OK.

Your new function appears in the Queries pane.

To ensure that Query1 doesn't show up in the field list for the report, which could potentially confuse users, you can disable it from loading in the report by right-clicking Query1 again and then selecting Enable load (selected by default) to disable the feature.

Select the SalesPersonID query that you loaded from the Excel worksheet and then, on the Add Column tab, select Invoke custom function to run the custom function that you created.

On the Invoke Custom Function window, select your function from the Function query list.


The New column name updates automatically and the table that contains the values that you're going to pass through the parameter is selected by default.
Select OK and, if necessary, run the native query.

A new column for your GetSalesFromSalesPerson function appears next to the SalesPersonID column.

Select the two arrows icon in the new column header and then select the check boxes of the columns that you want to load. This section is where you determine the details that are available in the report for each value (sales person ID).
Clear the Use original column name as prefix check box at the bottom of the screen because you don't need to see a prefix with the column names in the report.
Select OK.

You should be able to view the data for the columns that you selected, for each value (sales person ID).

If necessary, you can add more values (sales people IDs) to the SalesPersonID column in the Excel worksheet, or you can change the existing values.
Save your changes and then return to Power Query Editor.
On the Home tab, select Refresh Preview, and then run the native query again (if necessary). You should see the sales from the new sales people IDs that you added into the worksheet.
Select Close and Apply to return to the report editor, where you see the new column names in the Fields pane.


Now, you can start building your report.
[5] Get data from a NoSQL database
Some organizations don't use a relational database but instead use a NoSQL database. A NoSQL database (also referred to as non-SQL, not only SQL or non-relational) is a flexible type of database that doesn't use tables to store data.
Scenario
Software developers at Tailwind Traders created an application to manage shipping and tracking products from their warehouses. The application uses Cosmos DB, a NoSQL database, as the data repository. Data is stored as JSON documents, which are open standard file formats that are primarily used to transmit data between a server and web application. You need to import this data into a Power BI semantic model for reporting.
Connect to a NoSQL database (Azure Cosmos DB)
In this scenario, you'll use the Get data feature in Power BI Desktop. However, this time you'll select the More... option to locate and connect to the type of database that you use. In this example, you'll select the Azure category, select Azure Cosmos DB, and then select Connect.

On the Preview Connector window, select Continue and then enter your database credentials. In this example, on the Azure Cosmos DB window, you can enter the database details. You can specify the Azure Cosmos DB account endpoint URL that you want to get the data from (you can get the URL from the Keys blade of your Azure portal). Alternatively, you can enter the database name, collection name or use the navigator to select the database and collection to identify the data source.
If you're connecting to an endpoint for the first time, as you are in this example, make sure that you enter your account key. You can find this key in the Primary Key box in the Read-only Keys blade of your Azure portal.
Import a JSON file
If you're working with data stored in JSON format, it's often necessary to extract and normalize the data first. This is because JSON data is often stored in a nested or unstructured format, which makes it difficult to analyze or report on directly.
In this example, the data must be extracted and normalized before you can report on them, so you need to transform the data before loading it into Power BI Desktop.
After you've connected to the database account, the Navigator window opens, showing a list of databases under that account. Select the table that you want to import. In this example, you'll select the Product table. The preview pane only shows Record items because all records in the document are represented as a Record type in Power BI.

Select the Edit button to open the records in Power Query.
In Power Query, select the Expander button to the right side of the Column1 header, which displays the context menu with a list of fields. Select the fields that you want to load into Power BI Desktop, clear the Use original column name as prefix checkbox, and then select OK.

Review the selected data to ensure that you're satisfied with it, then select Close & Apply to load the data into Power BI Desktop.

The data now resembles a table with rows and columns. Data from Cosmos DB can now be related to data from other data sources and can eventually be used in a Power BI report.
[6] Get data from online services
To support their daily operations, organizations frequently use a range of software applications, such as SharePoint, OneDrive, Dynamics 365, Google Analytics and so on. These applications produce their own data. Power BI can combine the data from multiple applications to produce more meaningful insights and reports.
Scenario
Tailwind Traders uses SharePoint to collaborate and store sales data. It's the start of the new financial year and the sales managers want to enter new goals for the sales team. The form that the leadership uses exists in SharePoint. You're required to establish a connection to this data within Power BI Desktop, so that the sales goals can be used alongside other sales data to determine the health of the sales pipeline.
The following sections examine how to use the Power BI Desktop Get Data feature to connect to data sources that are produced by external applications. To illustrate this process, we've provided an example that shows how to connect to a SharePoint site and import data from an online list.
Connect to data in an application
When connecting to data in an application, you would begin in the same way as you would when connecting to the other data sources: by selecting the Get data feature in Power BI Desktop. Then, select the option that you need from the Online Services category. In this example, you select SharePoint Online List.
After you've selected Connect, you'll be asked for your SharePoint URL. This URL is the one that you use to sign into your SharePoint site through a web browser. You can copy the URL from your SharePoint site and paste it into the connection window in Power BI. You don't need to enter your full URL file path; you only need to load your site URL because, when you're connected, you can select the specific list that you want to load. Depending on the URL that you copied, you might need to delete the last part of your URL, as illustrated in the following image.

After you've entered your URL, select OK. Power BI needs to authorize the connection to SharePoint, so sign in with your Microsoft account and then select Connect.

Choose the application data to import
After Power BI has made the connection with SharePoint, the Navigator window appears, as it does when you connect to other data sources. The window displays the tables and entities within your SharePoint site. Select the list that you want to load into Power BI Desktop. Similar to when you import from other data sources, you have the option to automatically load your data into a Power BI model or launch the Power Query Editor to transform your data before loading it.
For this example, you select the Load option.

[7] Select a storage mode
The most popular way to use data in Power BI is to import it into a Power BI semantic model. Importing the data means that the data is stored in the Power BI file and gets published along with the Power BI reports. This process helps make it easier for you to interact directly with your data. However, this approach might not work for all organizations.
To continue with the scenario, you're building Power BI reports for the Sales department at Tailwind Traders, where importing the data isn't an ideal method. The first task you need to accomplish is to create your semantic models in Power BI so you can build visuals and other report elements. The Sales department has many different semantic models of varying sizes. For security reasons, you aren't allowed to import local copies of the data into your reports, so directly importing data is no longer an option. Therefore, you need to create a direct connection to the Sales department’s data source. The following section describes how you can ensure that these business requirements are satisfied when you're importing data into Power BI.
However, sometimes there may be security requirements around your data that make it impossible to directly import a copy. Or your semantic models may simply be too large and would take too long to load into Power BI, and you want to avoid creating a performance bottleneck. Power BI solves these problems by using the DirectQuery storage mode, which allows you to query the data in the data source directly and not import a copy into Power BI. DirectQuery is useful because it ensures you're always viewing the most recent version of the data.
The three different types of storage modes you can choose from:
Import
DirectQuery
Dual (Composite)
You can access storage modes by switching to the Model view, selecting a data table, and in the resulting Properties pane, selecting which mode that you want to use from the Storage mode drop-down list, as shown in the following visual.

Let’s take a closer look at the different types of Storage Modes.
Import mode
The Import mode allows you to create a local Power BI copy of your semantic models from your data source. You can use all Power BI service features with this storage mode, including Q&A and Quick Insights. Data refreshes can be scheduled or on-demand. Import mode is the default for creating new Power BI reports.
DirectQuery mode
The DirectQuery option is useful when you don't want to save local copies of your data because your data won't be cached. Instead, you can query the specific tables that you'll need by using native Power BI queries, and the required data will be retrieved from the underlying data source. Essentially, you're creating a direct connection to the data source. Using this model ensures that you're always viewing the most up-to-date data, and that all security requirements are satisfied. Additionally, this mode is suited for when you have large semantic models to pull data from. Instead of slowing down performance by having to load large amounts of data into Power BI, you can use DirectQuery to create a connection to the source, solving data latency issues as well.
Dual (Composite mode)
In Dual mode, you can identify some data to be directly imported and other data that must be queried. Any table that is brought in to your report is a product of both Import and DirectQuery modes. Using the Dual mode allows Power BI to choose the most efficient form of data retrieval.
For more information regarding Storage Modes, refer to Storage Modes.
[8] Get data from Azure Analysis Services
Azure Analysis Services is a fully managed platform as a service (PaaS) that provides enterprise-grade semantic models in the cloud. You can use advanced mashup and modeling features to combine data from multiple data sources, define metrics, and secure your data in a single, trusted tabular semantic model. The semantic model provides an easier and faster way for users to perform ad hoc data analysis using tools like Power BI.
To resume the scenario, Tailwind Traders uses Azure Analysis Services to store financial projection data. You’ve been asked to compare this data with actual sales data in a different database. Getting data from Azure Analysis Services server is similar to getting data from SQL Server, in that you can:
Authenticate to the server.
Pick the model you want to use.
Select which tables you need.
Notable differences between Azure Analysis Services and SQL Server are:
Analysis Services models have calculations already created.
If you don’t need an entire table, you can query the data directly. Instead of using Transact-SQL (T-SQL) to query the data, like you would in SQL Server, you can use multi-dimensional expressions (MDX) or data analysis expressions (DAX).
Connect to data in Azure Analysis Services
As previously mentioned, you use the Get data feature in Power BI Desktop. When you select Analysis Services, you're prompted for the server address and the database name with two options: Import and Connect live.

Connect live is an option for Azure Analysis Services. Azure Analysis Services uses the tabular model and DAX to build calculations, similar to Power BI. These models are compatible with one another. Using the Connect live option helps you keep the data and DAX calculations in their original location, without having to import them all into Power BI. Azure Analysis Services can have a fast refresh schedule, which means that when data is refreshed in the service, Power BI reports will immediately be updated, without the need to initiate a Power BI refresh schedule. This process can improve the timeliness of the data in your report.
Similar to a relational database, you can choose the tables that you want to use. If you want to directly query the Azure Analysis Services model, you can use DAX or MDX.
You'll likely import the data directly into Power BI. An acceptable alternative is to import all other data that you want (from Excel, SQL Server, and so on) into the Azure Analysis Services model and then use a live connection. This approach simplifies your solution by keeping the semantic modeling and DAX measures in one place.
For more information on connecting Power BI to Azure Analysis Services, see Connect with Power BI documentation.
[9] Fix performance issues
Occasionally, organizations will need to address performance issues when running reports. Power BI provides the Performance Analyzer tool to help fix problems and streamline the process.
Consider the scenario where you're building reports for the Sales team in your organization. You’ve imported your data, which is in several tables within the Sales team’s SQL database, by creating a data connection to the database through DirectQuery. When you create preliminary visuals and filters, you notice that some tables are queried faster than others, and some filters are taking longer to process compared to others.
Optimize performance in Power Query
The performance in Power Query depends on the performance at the data source level. The variety of data sources that Power Query offers is wide, and the performance tuning techniques for each source are equally wide. For instance, if you extract data from a Microsoft SQL Server, you should follow the performance tuning guidelines for the product. Good SQL Server performance tuning techniques include index creation, hardware upgrades, execution plan tuning, and data compression. These topics are beyond the scope here, and are covered only as an example to build familiarity with your data source and reap the benefits when using Power BI and Power Query.
Power Query takes advantage of good performance at the data source through a technique called Query Folding.
Query folding
The query folding within Power Query Editor helps you increase the performance of your Power BI reports. Query folding is the process by which the transformations and edits that you make in Power Query Editor are simultaneously tracked as native queries, or simple Select SQL statements, while you're actively making transformations. The reason for implementing this process is to ensure that these transformations can take place in the original data source server and don't overwhelm Power BI computing resources.
You can use Power Query to load data into Power BI. Then use Power Query Editor to transform your data, such as renaming or deleting columns, appending, parsing, filtering, or grouping your data.
Consider a scenario where you’ve renamed a few columns in the Sales data and merged a city and state column together in the “city state” format. Meanwhile, the query folding feature tracks those changes in native queries. Then, when you load your data, the transformations take place independently in the original source, this ensures that performance is optimized in Power BI.
The benefits to query folding include:
More efficiency in data refreshes and incremental refreshes. When you import data tables by using query folding, Power BI is better able to allocate resources and refresh the data faster because Power BI doesn't have to run through each transformation locally.
Automatic compatibility with DirectQuery and Dual storage modes. All DirectQuery and Dual storage mode data sources must have the back-end server processing abilities to create a direct connection, which means that query folding is an automatic capability that you can use. If all transformations can be reduced to a single Select statement, then query folding can occur.
The following scenario shows query folding in action. In this scenario, you apply a set of queries to multiple tables. After you add a new data source by using Power Query, and you're directed to the Power Query Editor, you go to the Query Settings pane and right-click the last applied step, as shown in the following figure.

If the View Native Query option isn't available (not displayed in bold type), then query folding isn't possible for this step, and you'll have to work backward in the Applied Steps area until you reach the step in which View Native Query is available (displays in bold type). This process will reveal the native query that is used to transform the semantic model.
Native queries aren't possible for the following transformations:
Adding an index column
Merging and appending columns of different tables with two different sources
Changing the data type of a column
A good guideline to remember is that if you can translate a transformation into a Select SQL statement, which includes operators and clauses such as GROUP BY, SORT BY, WHERE, UNION ALL, and JOIN, you can use query folding.
While query folding is one option to optimize performance when retrieving, importing, and preparing data, another option is query diagnostics.
Query diagnostics
Another tool that you can use to study query performance is query diagnostics. You can determine what bottlenecks may exist while loading and transforming your data, refreshing your data in Power Query, running SQL statements in Query Editor, and so on.
To access query diagnostics in Power Query Editor, go to Tools in the Home ribbon. When you're ready to begin transforming your data or making other edits in Power Query Editor, select Start Diagnostics in the Session Diagnostics section. When you're finished, make sure that you select Stop Diagnostics.

Selecting Diagnose Step shows you the length of time that it takes to run that step, as shown in the following image. This selection can tell you if a step takes longer to complete than others, which then serves as a starting point for further investigation.

This tool is useful when you want to analyze performance on the Power Query side for tasks such as loading semantic models, running data refreshes, or running other transformative tasks.
Other techniques to optimize performance
Other ways to optimize query performance in Power BI include:
Process as much data as possible in the original data source. Power Query and Power Query Editor allow you to process the data; however, the processing power that is required to complete this task might lower performance in other areas of your reports. Generally, a good practice is to process, as much as possible, in the native data source.
Use native SQL queries. When using DirectQuery for SQL databases, such as the case for our scenario, make sure that you aren't pulling data from stored procedures or common table expressions (CTEs).
Separate date and time, if bound together. If any of your tables have columns that combine date and time, make sure that you separate them into distinct columns before importing them into Power BI. This approach will increase compression abilities.
For more information, refer to Query Folding Guidance and Query Folding.
[10] Resolve data import errors
While importing data into Power BI, you may encounter errors resulting from factors such as:
Power BI imports from numerous data sources.
Each data source might have dozens (and sometimes hundreds) of different error messages.
Other components can cause errors, such as hard drives, networks, software services, and operating systems.
Data often can't comply with any specific schema.
The following sections cover some of the more common error messages that you might encounter in Power BI.
Query timeout expired
Relational source systems often have many people who are concurrently using the same data in the same database. Some relational systems and their administrators seek to limit a user from monopolizing all hardware resources by setting a query timeout. These timeouts can be configured for any timespan, from as little as five seconds to as much as 30 minutes or more.
For instance, if you’re pulling data from your organization’s SQL Server, you might see the error shown in the following figure.

Power BI Query Error: Timeout expired
This error indicates that you’ve pulled too much data according to your organization’s policies. Administrators incorporate this policy to avoid slowing down a different application or suite of applications that might also be using that database.
You can resolve this error by pulling fewer columns or rows from a single table. While you're writing SQL statements, it might be a common practice to include groupings and aggregations. You can also join multiple tables in a single SQL statement. Additionally, you can perform complicated subqueries and nested queries in a single statement. These complexities add to the query processing requirements of the relational system and can greatly elongate the time of implementation.
If you need the rows, columns, and complexity, consider taking small chunks of data and then bringing them back together by using Power Query. For instance, you can combine half the columns in one query and the other half in a different query. Power Query can merge those two queries back together after you're finished.
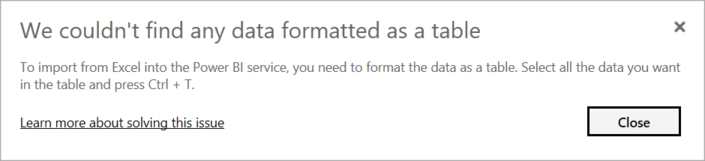
We couldn't find any data formatted as a table
Occasionally, you may encounter the “We couldn’t find any data formatted as a table” error while importing data from Microsoft Excel. Fortunately, this error is self-explanatory. Power BI expects to find data formatted as a table from Excel. The error even tells you the resolution. Perform the following steps to resolve the issue:
Open your Excel workbook, and highlight the data that you want to import.
Press the Ctrl-T keyboard shortcut. The first row will likely be your column headers.
Verify that the column headers reflect how you want to name your columns. Then, try to import data from Excel again. This time, it should work.

Couldn't find file
While importing data from a file, you may get the "Couldn't find file" error.

Usually, this error is caused by the file moving locations or the permissions to the file changing. If the cause is the former, you need to find the file and change the source settings.
Open Power Query by selecting the Transform Data button in Power BI.
Highlight the query that is creating the error.
On the left, under Query Settings, select the gear icon next to Source.
Change the file location to the new location.


Data type errors
Sometimes, when you import data into Power BI, the columns appear blank. This situation happens because of an error in interpreting the data type in Power BI. The resolution to this error is unique to the data source. For instance, if you're importing data from SQL Server and see blank columns, you could try to convert to the correct data type in the query.
Instead of using this query:
SELECT CustomerPostalCode FROM Sales.Customers
Use this query:
SELECT CAST(CustomerPostalCode as varchar(10)) FROM Sales.Customers
By specifying the correct type at the data source, you eliminate many of these common data source errors.
You may encounter different types of errors in Power BI that are caused by the diverse data source systems where your data resides.
If you experience an error not covered, you can search Microsoft documentation for the error message, and the resolution you need.
[11] Exercise - Get data in Power BI
This unit includes a lab to complete.
Use the free resources provided in the lab to complete the exercises in this unit. You will not be charged for the lab environment; however, you may need to bring your own subscription depending on the lab.
Microsoft provides this lab experience and related content for educational purposes. All presented information is owned by Microsoft and intended solely for learning about the covered products and services in this Microsoft Learn module.
In this exercise, you learn how to:
Connect to different data sources.
Profile data using Power Query.
This lab takes approximately 30 minutes to complete.
Note
A virtual machine containing the client tools you need is provided, along with the exercise instructions. Use the "Launch lab" button to launch the virtual machine.
A limited number of concurrent sessions are available. If the hosted environment is unavailable, please try again later.
Alternatively, you can open the instructions in a separate window.
Access your environment
Before you start this lab (unless you are continuing from a previous lab), select Launch lab above.
You are automatically logged in to your lab environment as data-ai\student.
You can now begin your work on this lab.
Tip
To dock the lab environment so that it fills the window, select the PC icon at the top and then select Fit Window to Machine.

[12] Check your knowledge
Knowledge Check
[1] When connecting to a SQL Server database to get data, what language should you use to extract data?
a. DAX
b. T-SQL
c. MDX
[2] You're creating a Power BI report with data from an Azure Analysis Services MDX Cube. When the data refreshes in the cube, you would like to see it immediately in the Power BI report. How should you connect?
a. Import
b. T-SQL
c. Live connection
[3] What can you do to improve performance when you're getting data in Power BI?
a. Remove unnecessary columns and rows
b. Export database files to CSV to load
c. Combine date and time columns into a single column
[13] Summary
In this module, you learned about pulling data from many different data sources and into Power BI. You can pull data from files, relational databases, Azure Analysis Services, cloud-based applications, websites, and more. Retrieving data from different data sources requires treating each data source differently. For instance, Microsoft Excel data should be pulled in from an Excel table. Relational databases often have query timeouts. You can connect to SQL Server Analysis Services with Connect live, which allows you to see data changes in real-time.
It's important to select the correct storage mode for your data. Do you require that visuals interact quickly but don’t mind possibly refreshing the data when the underlying data source changes? If so, select Import to import data into Power BI. If you prefer to see updates to data as soon as they happen at the cost of interactivity performance, then choose Direct Query for your data instead.
In addition, you learned how to solve performance problems and data import errors. You learned that Power BI gives you tooling to identify where performance problems may exist. Data import errors can be alarming at first, but you can see that the resolution is easily implemented.
Source:
https://learn.microsoft.com/en-us/training/paths/prepare-data-power-bi/