Get Started Building with Power BI

Mohamad's interest is in Programming (Mobile, Web, Database and Machine Learning). He is studying at the Center For Artificial Intelligence Technology (CAIT), Universiti Kebangsaan Malaysia (UKM).
Power BI Overview
Microsoft Power BI is a complete reporting solution that covers data preparation, visualization, distribution, and management. It scales from simple reports with a single data source to complex models across an organization, enabling interactive, visually rich insights.
Key Components of Power BI
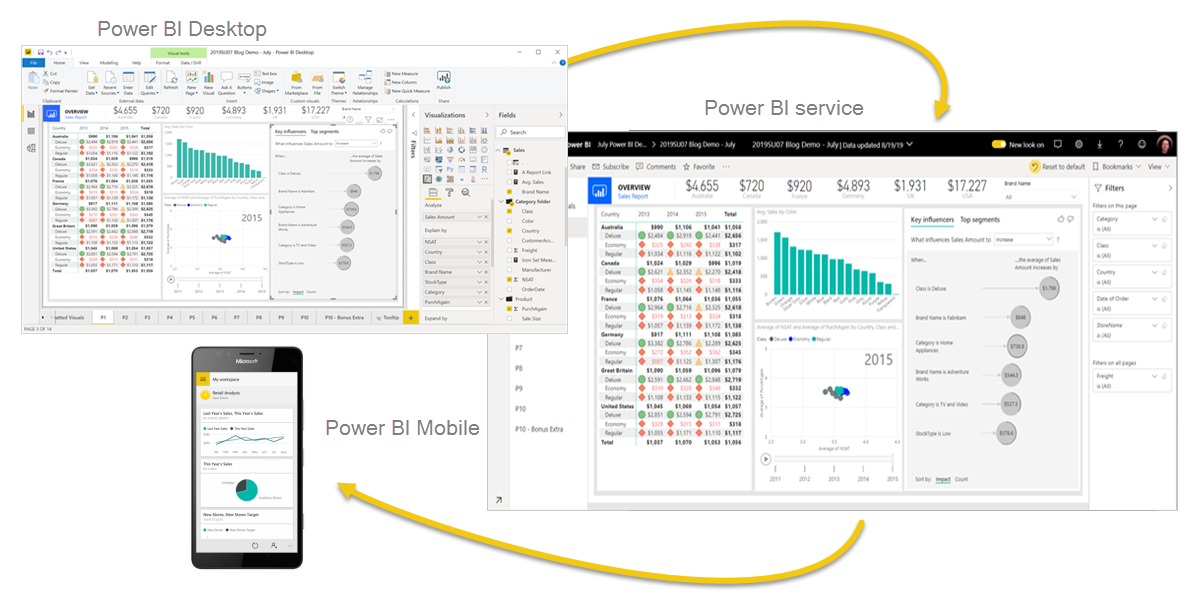
Power BI Desktop – A free Windows application for building reports, connecting to data, and modeling.
Power BI Service – Online platform (app.powerbi.com) for publishing, managing, and distributing reports and dashboards.
Power BI Mobile – Cross-platform app for accessing reports in mobile-optimized formats.
Flow of Power BI
Connect to and transform data in Power BI Desktop (using Power Query).
Model data and create relationships, calculations, and metrics.
Build reports with interactive visuals.
Publish reports to the Power BI service.
Distribute and manage content via dashboards, workspaces, and apps.
Building Blocks
Semantic Models: Connected data, transformations, relationships, and calculations that form the foundation of reports.
Visualizations: Drag-and-drop visuals on report pages to tell stories with data. Interactivity allows filtering, drill through, and cross-highlighting.
Dashboards: Single-page views in the Power BI service that combine tiles from multiple reports, giving users a high-level summary.
Power BI Service Features
Workspaces: Collaborative spaces to publish and manage content.
Apps: Packaged reports and dashboards shared with audiences in a controlled way.
Template Apps: Prebuilt apps (e.g., GitHub insights) that can be connected to organizational data.
Data Refresh: Scheduled or on-demand updates to keep reports current.
Conclusion
Power BI empowers users to connect, model, and visualize data seamlessly while supporting secure collaboration and distribution. By combining semantic models, visuals, dashboards, and apps, it transforms raw data into actionable business insights.