Get started building with Power BI

Mohamad's interest is in Programming (Mobile, Web, Database and Machine Learning). He is studying at the Center For Artificial Intelligence Technology (CAIT), Universiti Kebangsaan Malaysia (UKM).
Learn about Power BI, the building blocks and flow of Power BI, and how to create compelling, interactive reports.
This module helps prepare you for Exam PL-200: Microsoft Power Platform Functional Consultant.
Learning objectives
In this module, you'll learn:
How Power BI services and applications work together.
Explore how Power BI can make your business more efficient.
How to create compelling visuals and reports.
[1] Introduction
Microsoft Power BI is a complete reporting solution that offers data preparation, data visualization, distribution, and management through development tools and an online platform.
Power BI can scale from simple reports using a single data source to reports requiring complex data modeling and consistent themes. Use Power BI to create visually stunning, interactive reports to serve as the analytics and decision engine behind group projects, divisions, or entire organizations.
Power BI is an essential tool to data analysts and their organization; however, all data professionals benefit from understanding how Power BI works to explore and present data insights within organizations.
[2] Use Power BI
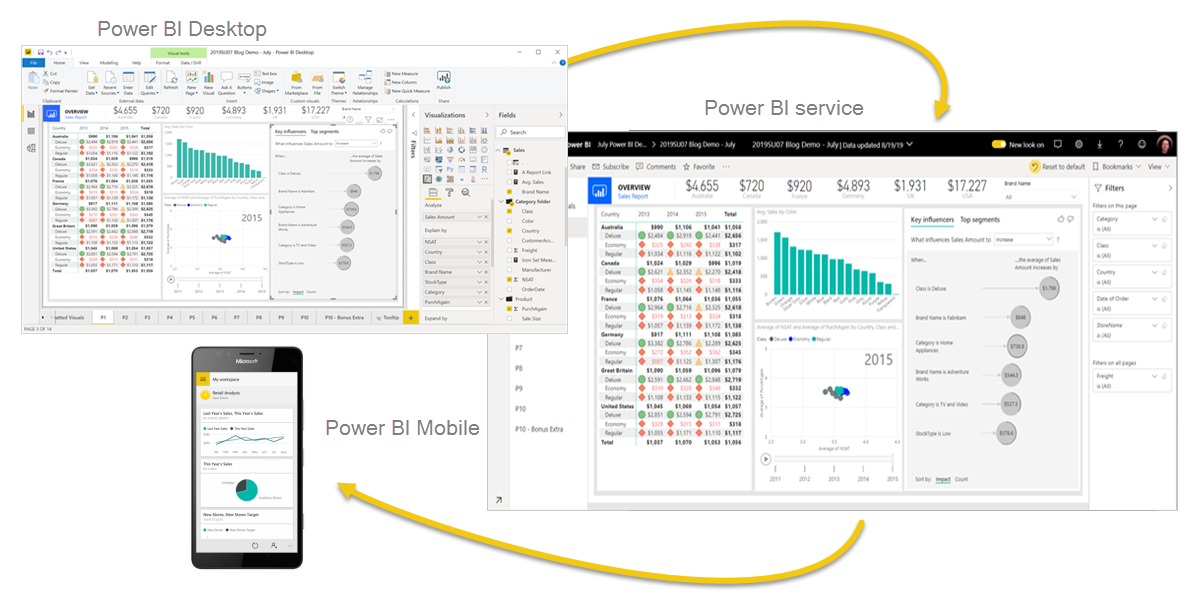
In order to create reports with Power BI, you must first understand the tools necessary. There are three primary components to Power BI:
Power BI Desktop (desktop application)
Power BI service (online platform)
Power BI Mobile (cross-platform mobile app)
Power BI Desktop is the development tool available to data analysts and other report creators. While the Power BI service allows you to organize, manage, and distribute your reports and other Power BI items. Power BI Desktop is available to download for free either through the Windows store or as a direct installer.
You can access the Power BI service at app.powerbi.com with a school or work account. If your organization doesn't already use Power BI, you can still explore the service by getting a free trial or signing up for a free Microsoft 365 Developer account.
Power BI Mobile allows consumers to view reports in a mobile-optimized format. You can create these optimized report views in Power BI Desktop.
Explore the flow of Power BI
There's a common flow when creating reports with Power BI. First, you start with Power BI Desktop to connect to data and create the report. Then you publish the report to the Power BI service and distribute to consumers.
The flow of Power BI is:
Connect to data with Power BI Desktop.
Transform data with Power Query Editor (comes with Power BI Desktop).
Model data with Power BI Desktop.
Create visualizations and reports with Power BI Desktop.
Publish report to Power BI service.
Distribute and manage reports in the Power BI service.
The Power BI service also allows you to create high-level dashboards that drill down to reports, and apps to easily group related reports to users in a simple format.
Tip
See additional details about Power BI in the reference documentation.
[3] Building blocks of Power BI
The building blocks of Power BI are semantic models and visualizations. Create a semantic model and then use visuals to build a report. Let's explore these items in more detail and how they relate to the flow of Power BI.
Create a semantic model
A semantic model consists of all connected data, transformations, relationships, and calculations. To follow the flow of Power BI, you first connect to data, transform data, and create relationships and calculations to create a semantic model.
First, connect to as many data sources you need. Then clean and transform the data to your needs, using Power Query Editor. Add relationships between tables and calculations to extend the semantic model. After all of that, now you can create a report.
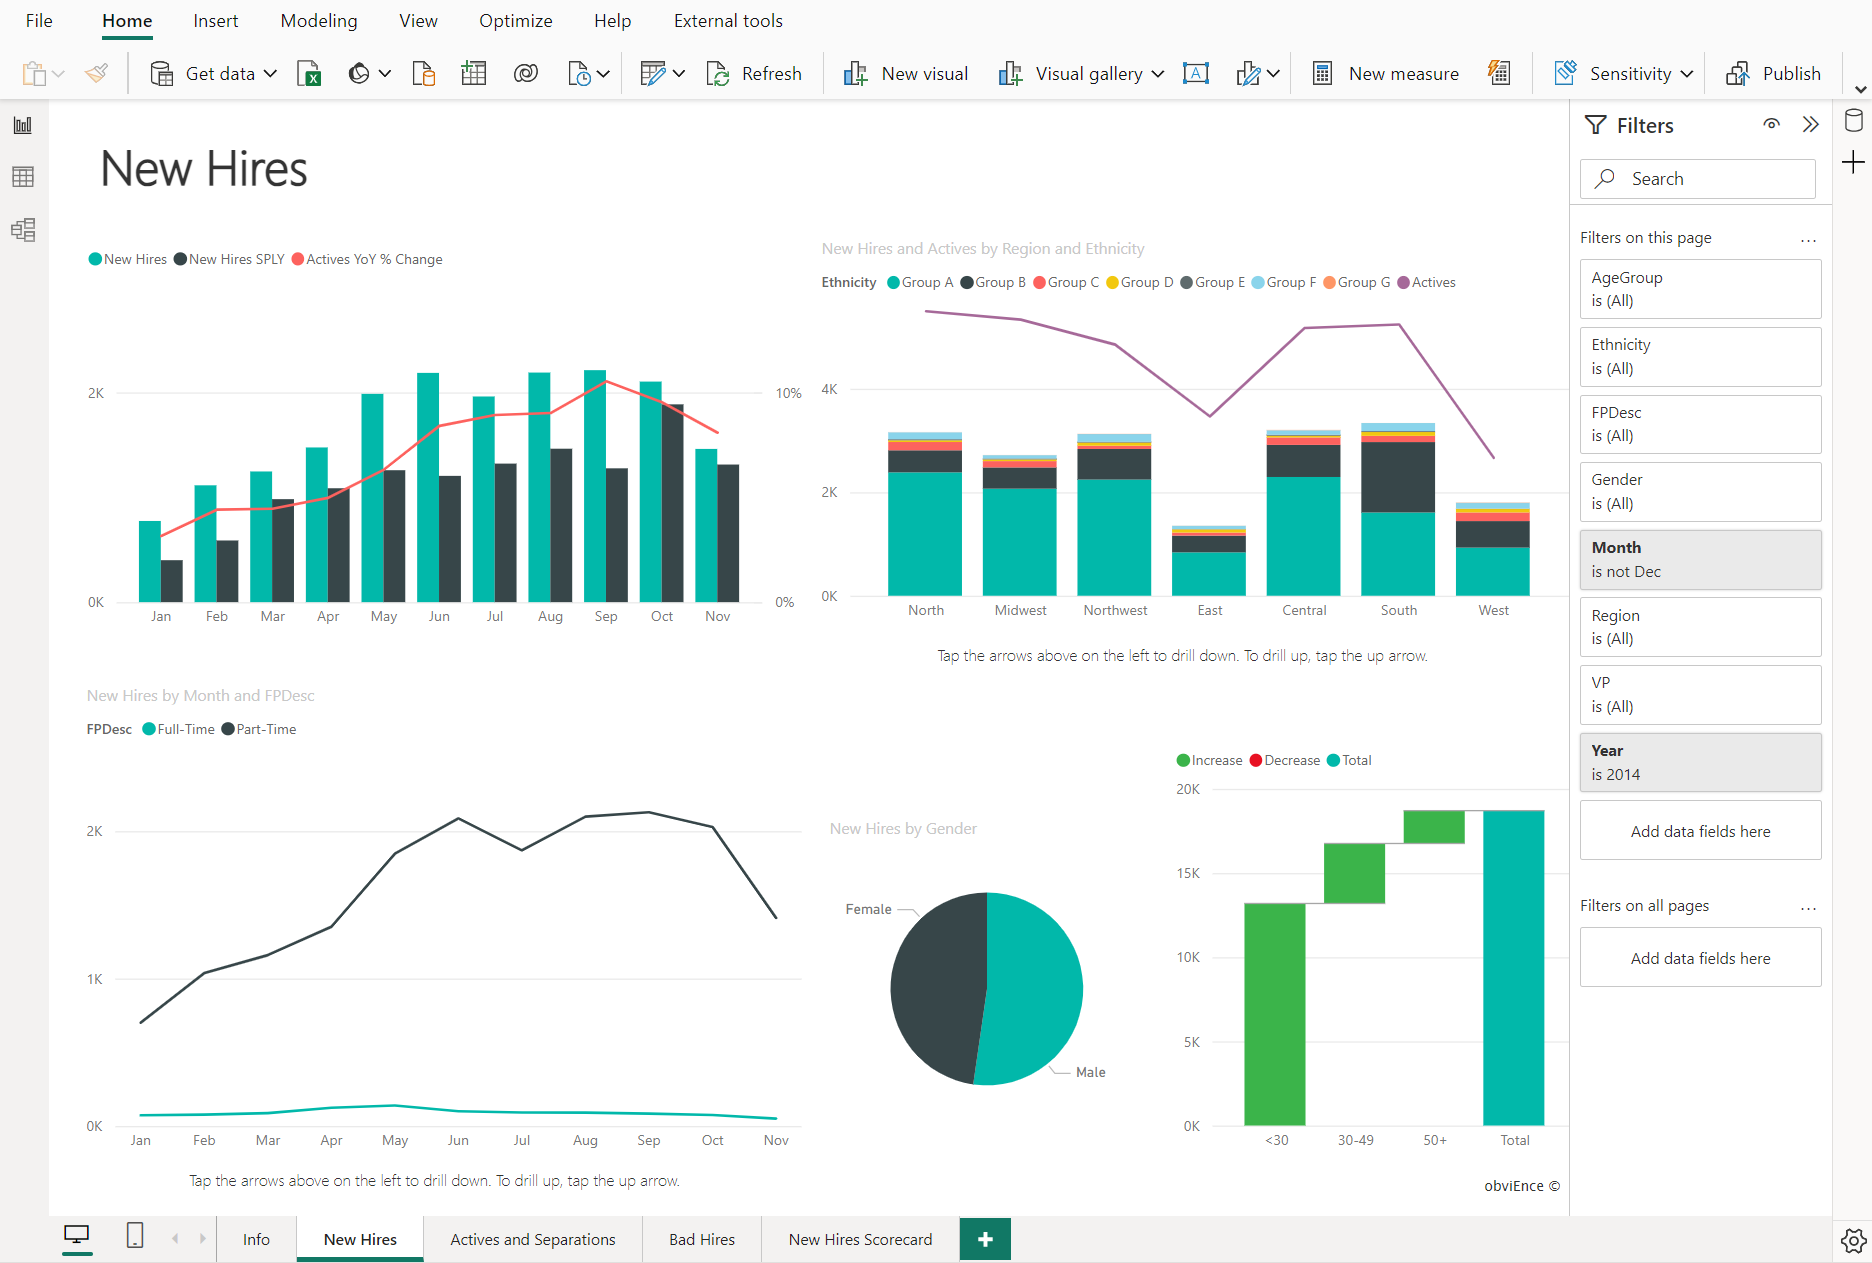
Create visualizations in a report
In Power BI Desktop, when you create a visualization (also called visual), you add it to the canvas for a report page. Choose your visualizations to build pages in your report. It's ideal to keep each page simple with related data, so consumers can easily see the insights.
Power BI is a low-code solution, which means that you can "drag and drop" data field directly onto the canvas. Power BI will choose a visual for your data field. You can easily change between visuals for the same fields, and add or remove data fields to the visual.
One of the most valuable features of Power BI reports is the interactivity between visuals. Consumers can select different data points in the visual and see how that affects the other visuals. Depending on your design, they can also drillthrough from one visual to more detail or filter based on different fields in the report.
Once you're satisfied with your report, you publish it to the Power BI service.
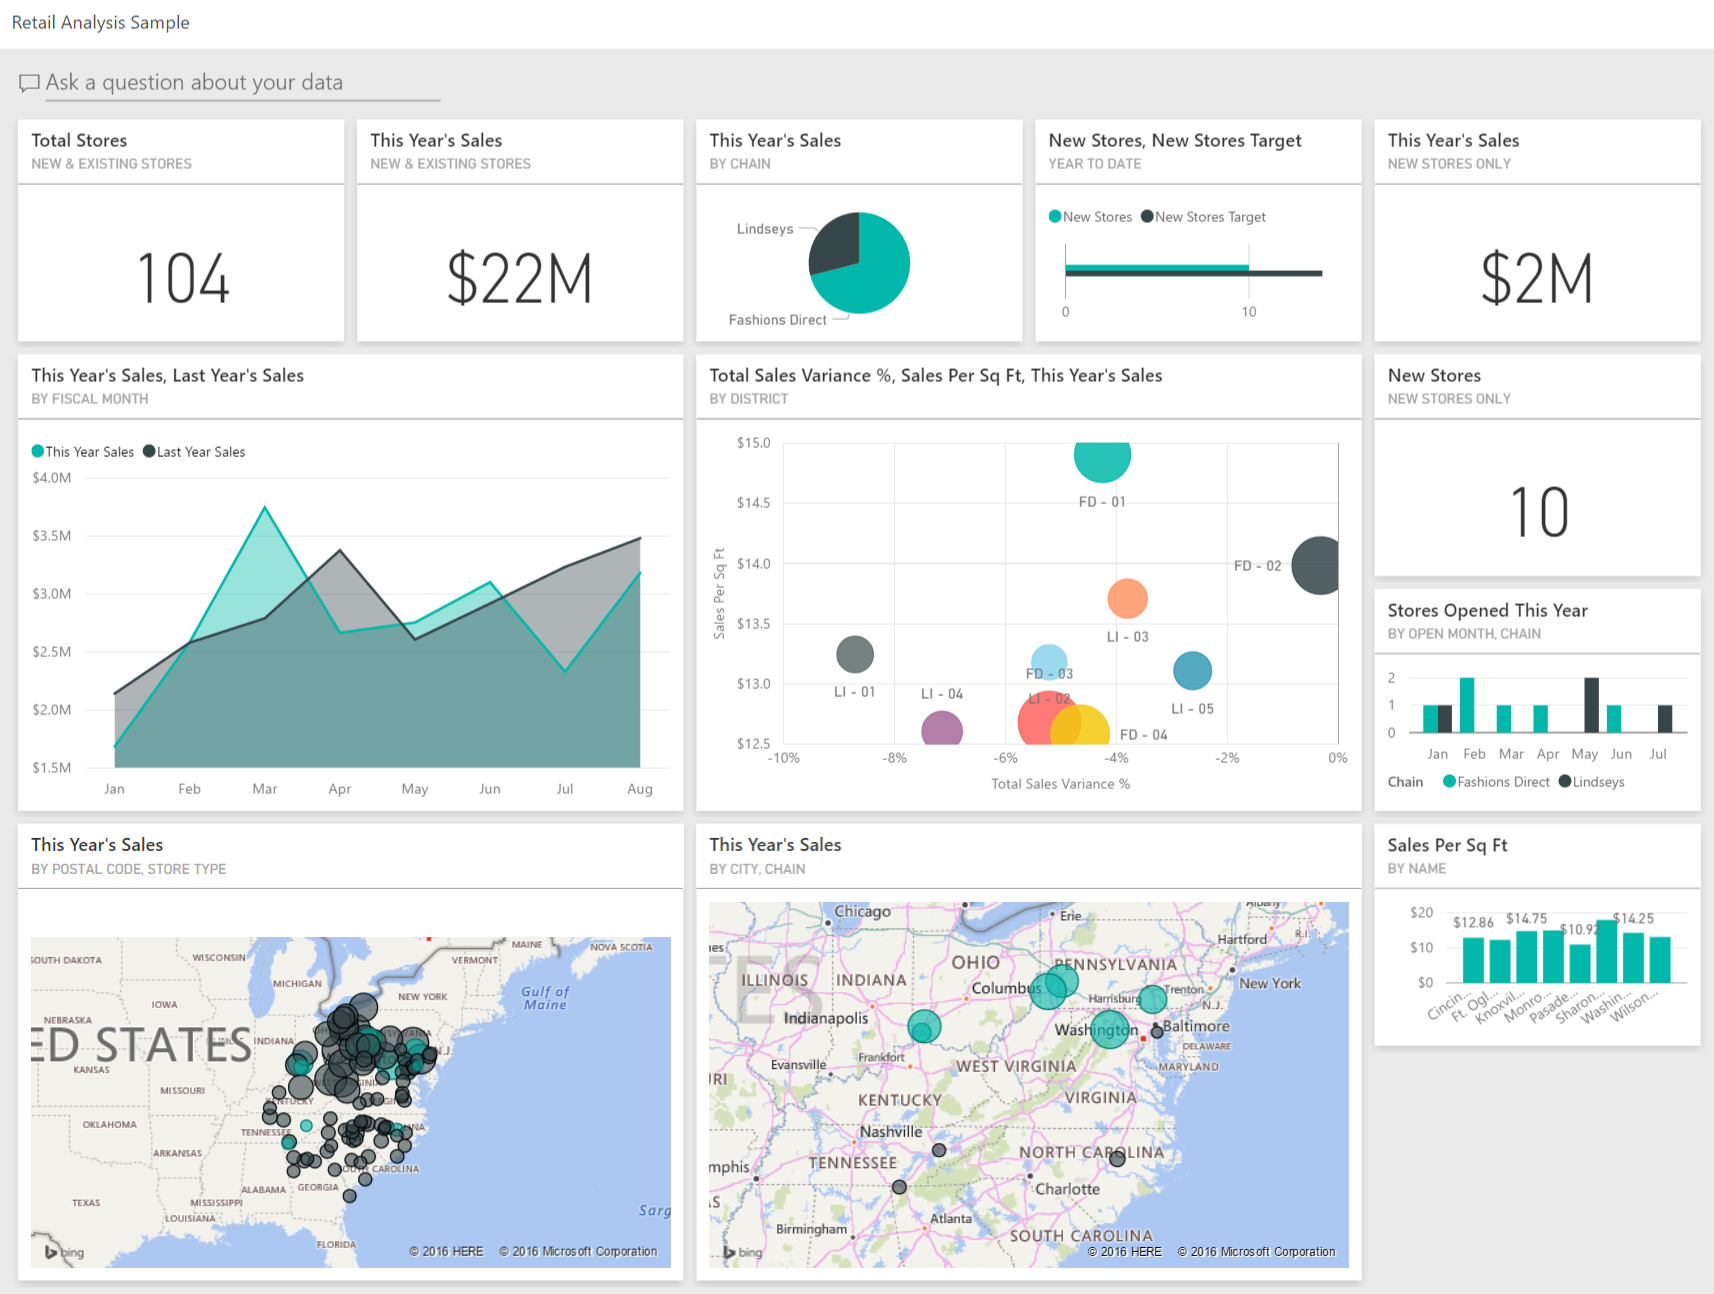
Create a dashboard
In the Power BI service, you can also create dashboards after you've published a report. Dashboards consist of a single page made up of tiles. Add tiles to a dashboard by pinning a visual in a report to the dashboard. Tiles aren't interactive like visuals, so when a user interacts with the tile, they go to the underlying report for more information.
Dashboards are an excellent way to provide high-level information to consumers. Similar to a dashboard in a vehicle, include the most important information in a dashboard. Then consumers can go to the report for more details.
To recap, the building blocks of Power BI are semantic models and visuals. Using Power BI Desktop, you create the semantic model and use visuals to create reports.
In the Power BI service, you can distribute content to your consumers and use reports to create dashboards.
[4] Tour and use the Power BI service
Now that you understand how to create a report, let's explore the Power BI service. The Power BI service provides a simple and interactive user experience to take your data analytics to the next level.
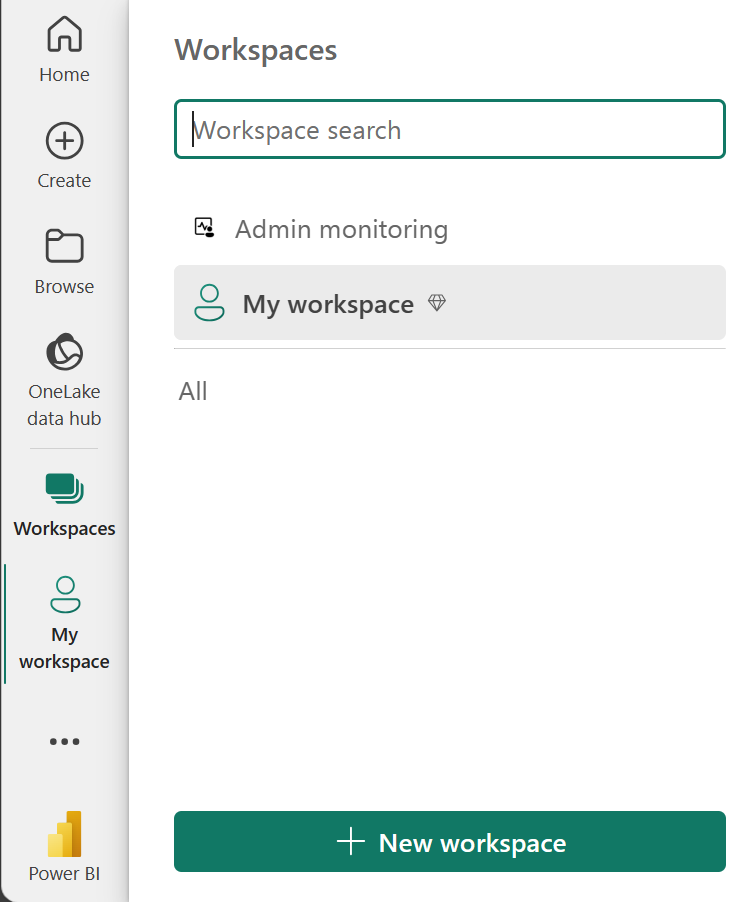
Organize items with workspaces
Workspaces are the foundation of the Power BI service. When publishing any report, you must choose a workspace. By default, every user has access to My workspace, which is ideal only for testing. When you want to share content with others, always create and use a shared workspace.
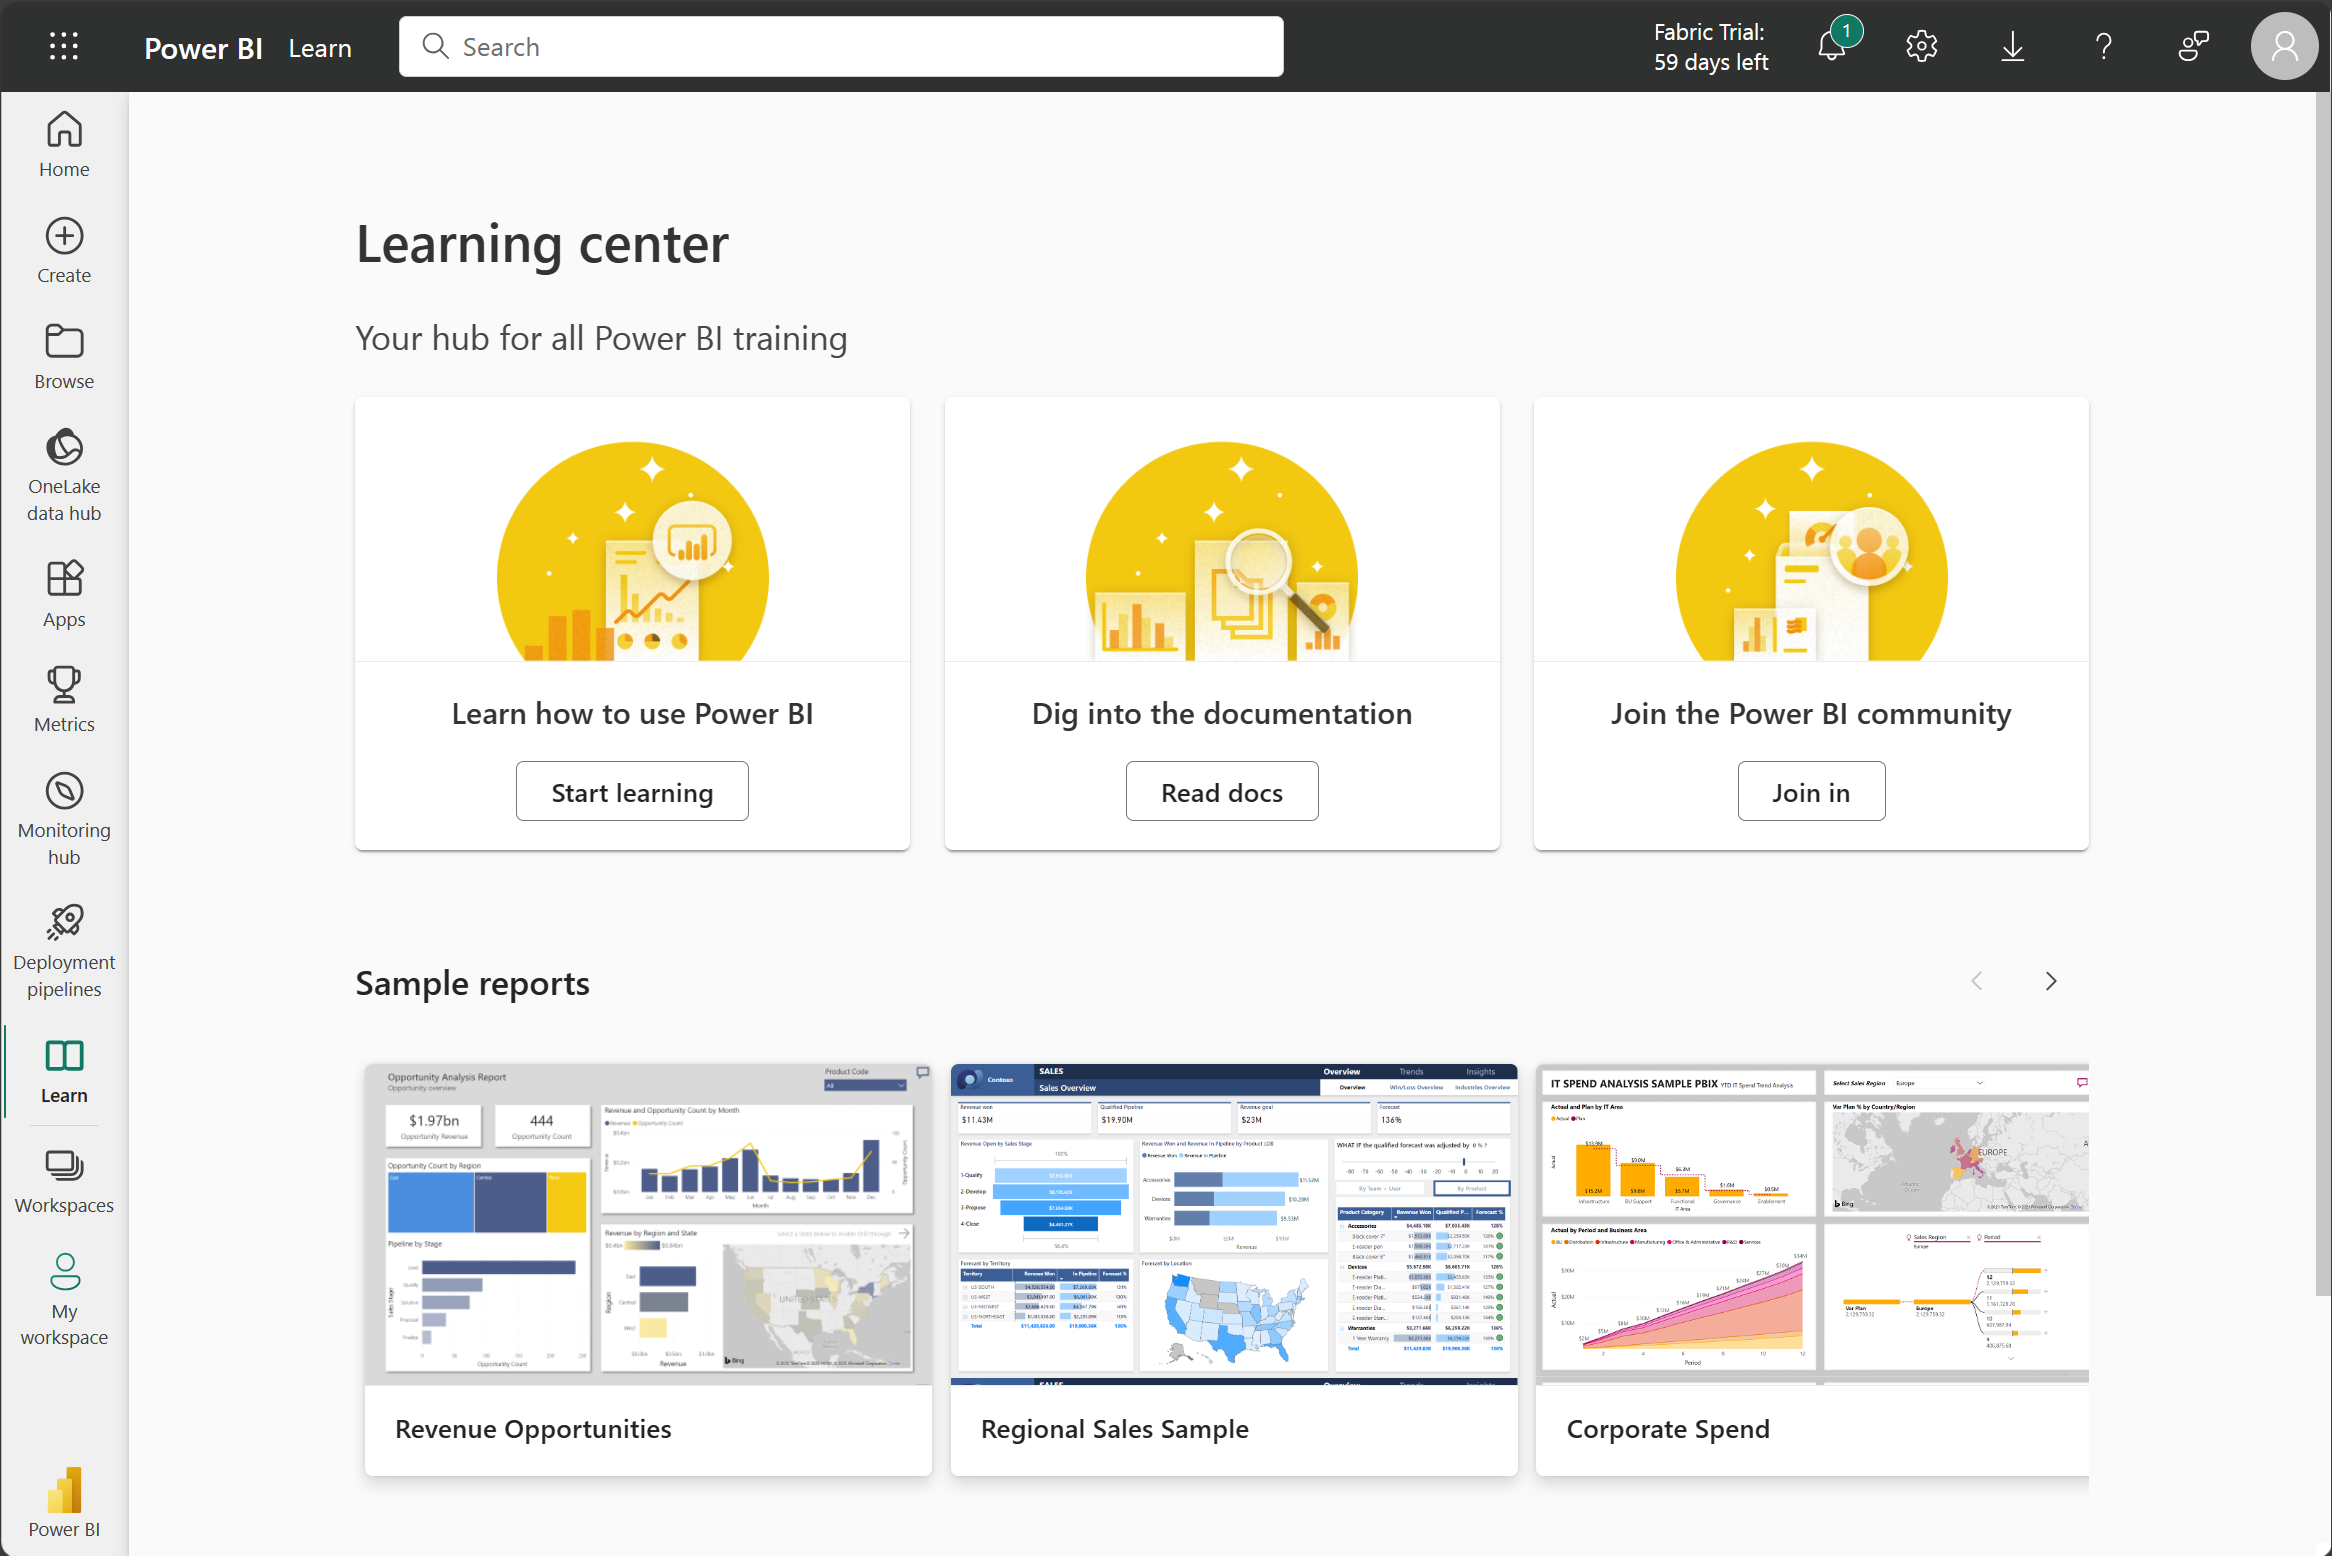
Explore sample reports
If you haven't created a report yet, Power BI offers several sample reports for you to explore. These reports load to My workspace so you can explore privately. You can access sample reports in the Learn section of the navigation pane.
Distribute content
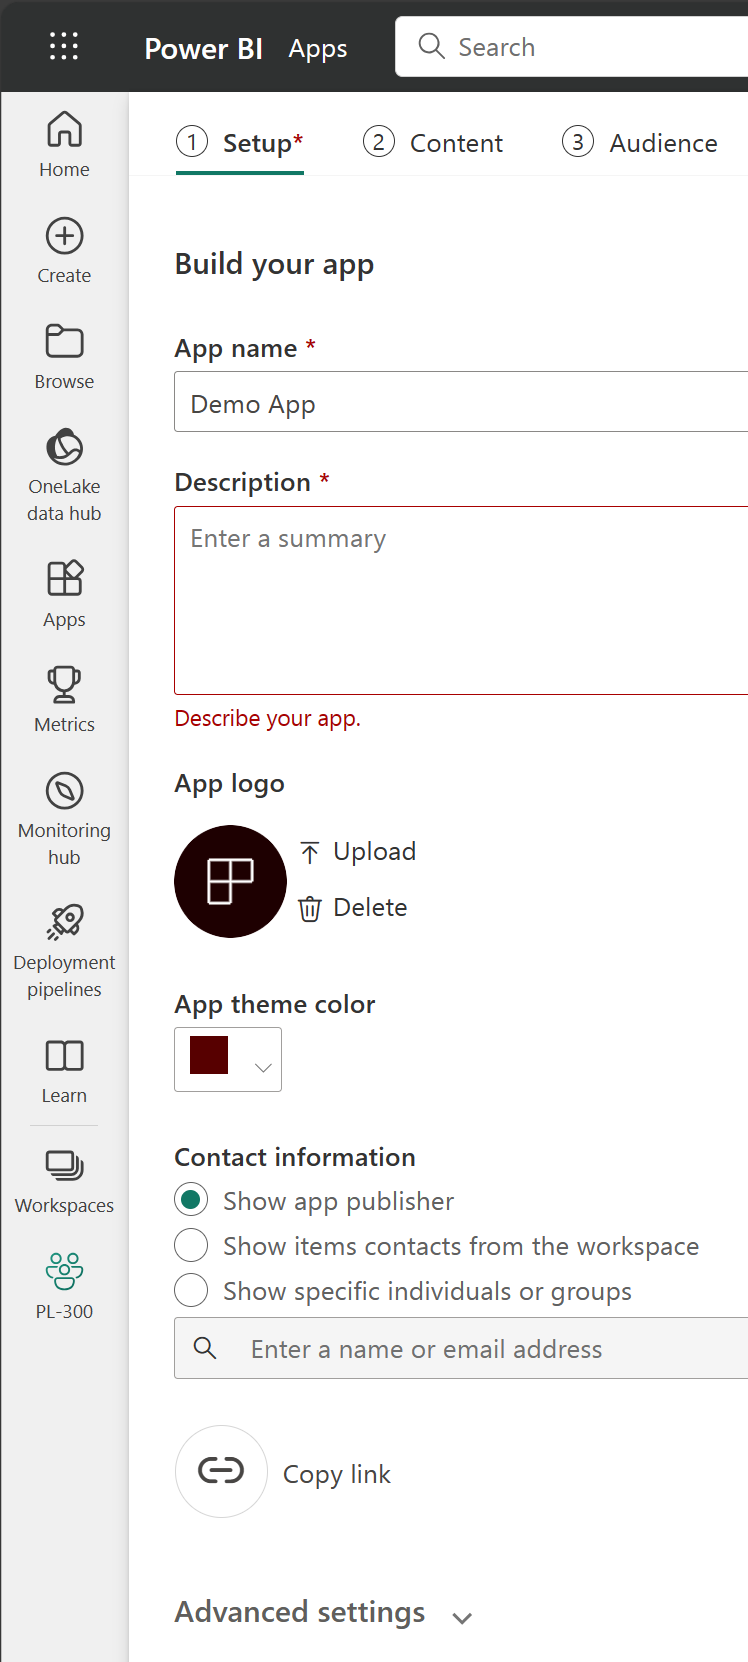
In a workspace, you can create an app, which provides consumers a simplified interface to access reports and dashboards. In the app configuration, you set up the app, select the content to include (limited to the current workspace), and choose your audience.
Once you create an app, you must update the app after each change to items in the workspace. The requirement to update the app allows you to control what version of the content is visible to your audience.
Apps are the ideal sharing solution within any organization. While you can grant access to the workspace, workspace permissions may grant users access to more content than desired. Sharing individual items also presents a problem if you make changes you don't want consumers to see yet.
Explore template apps
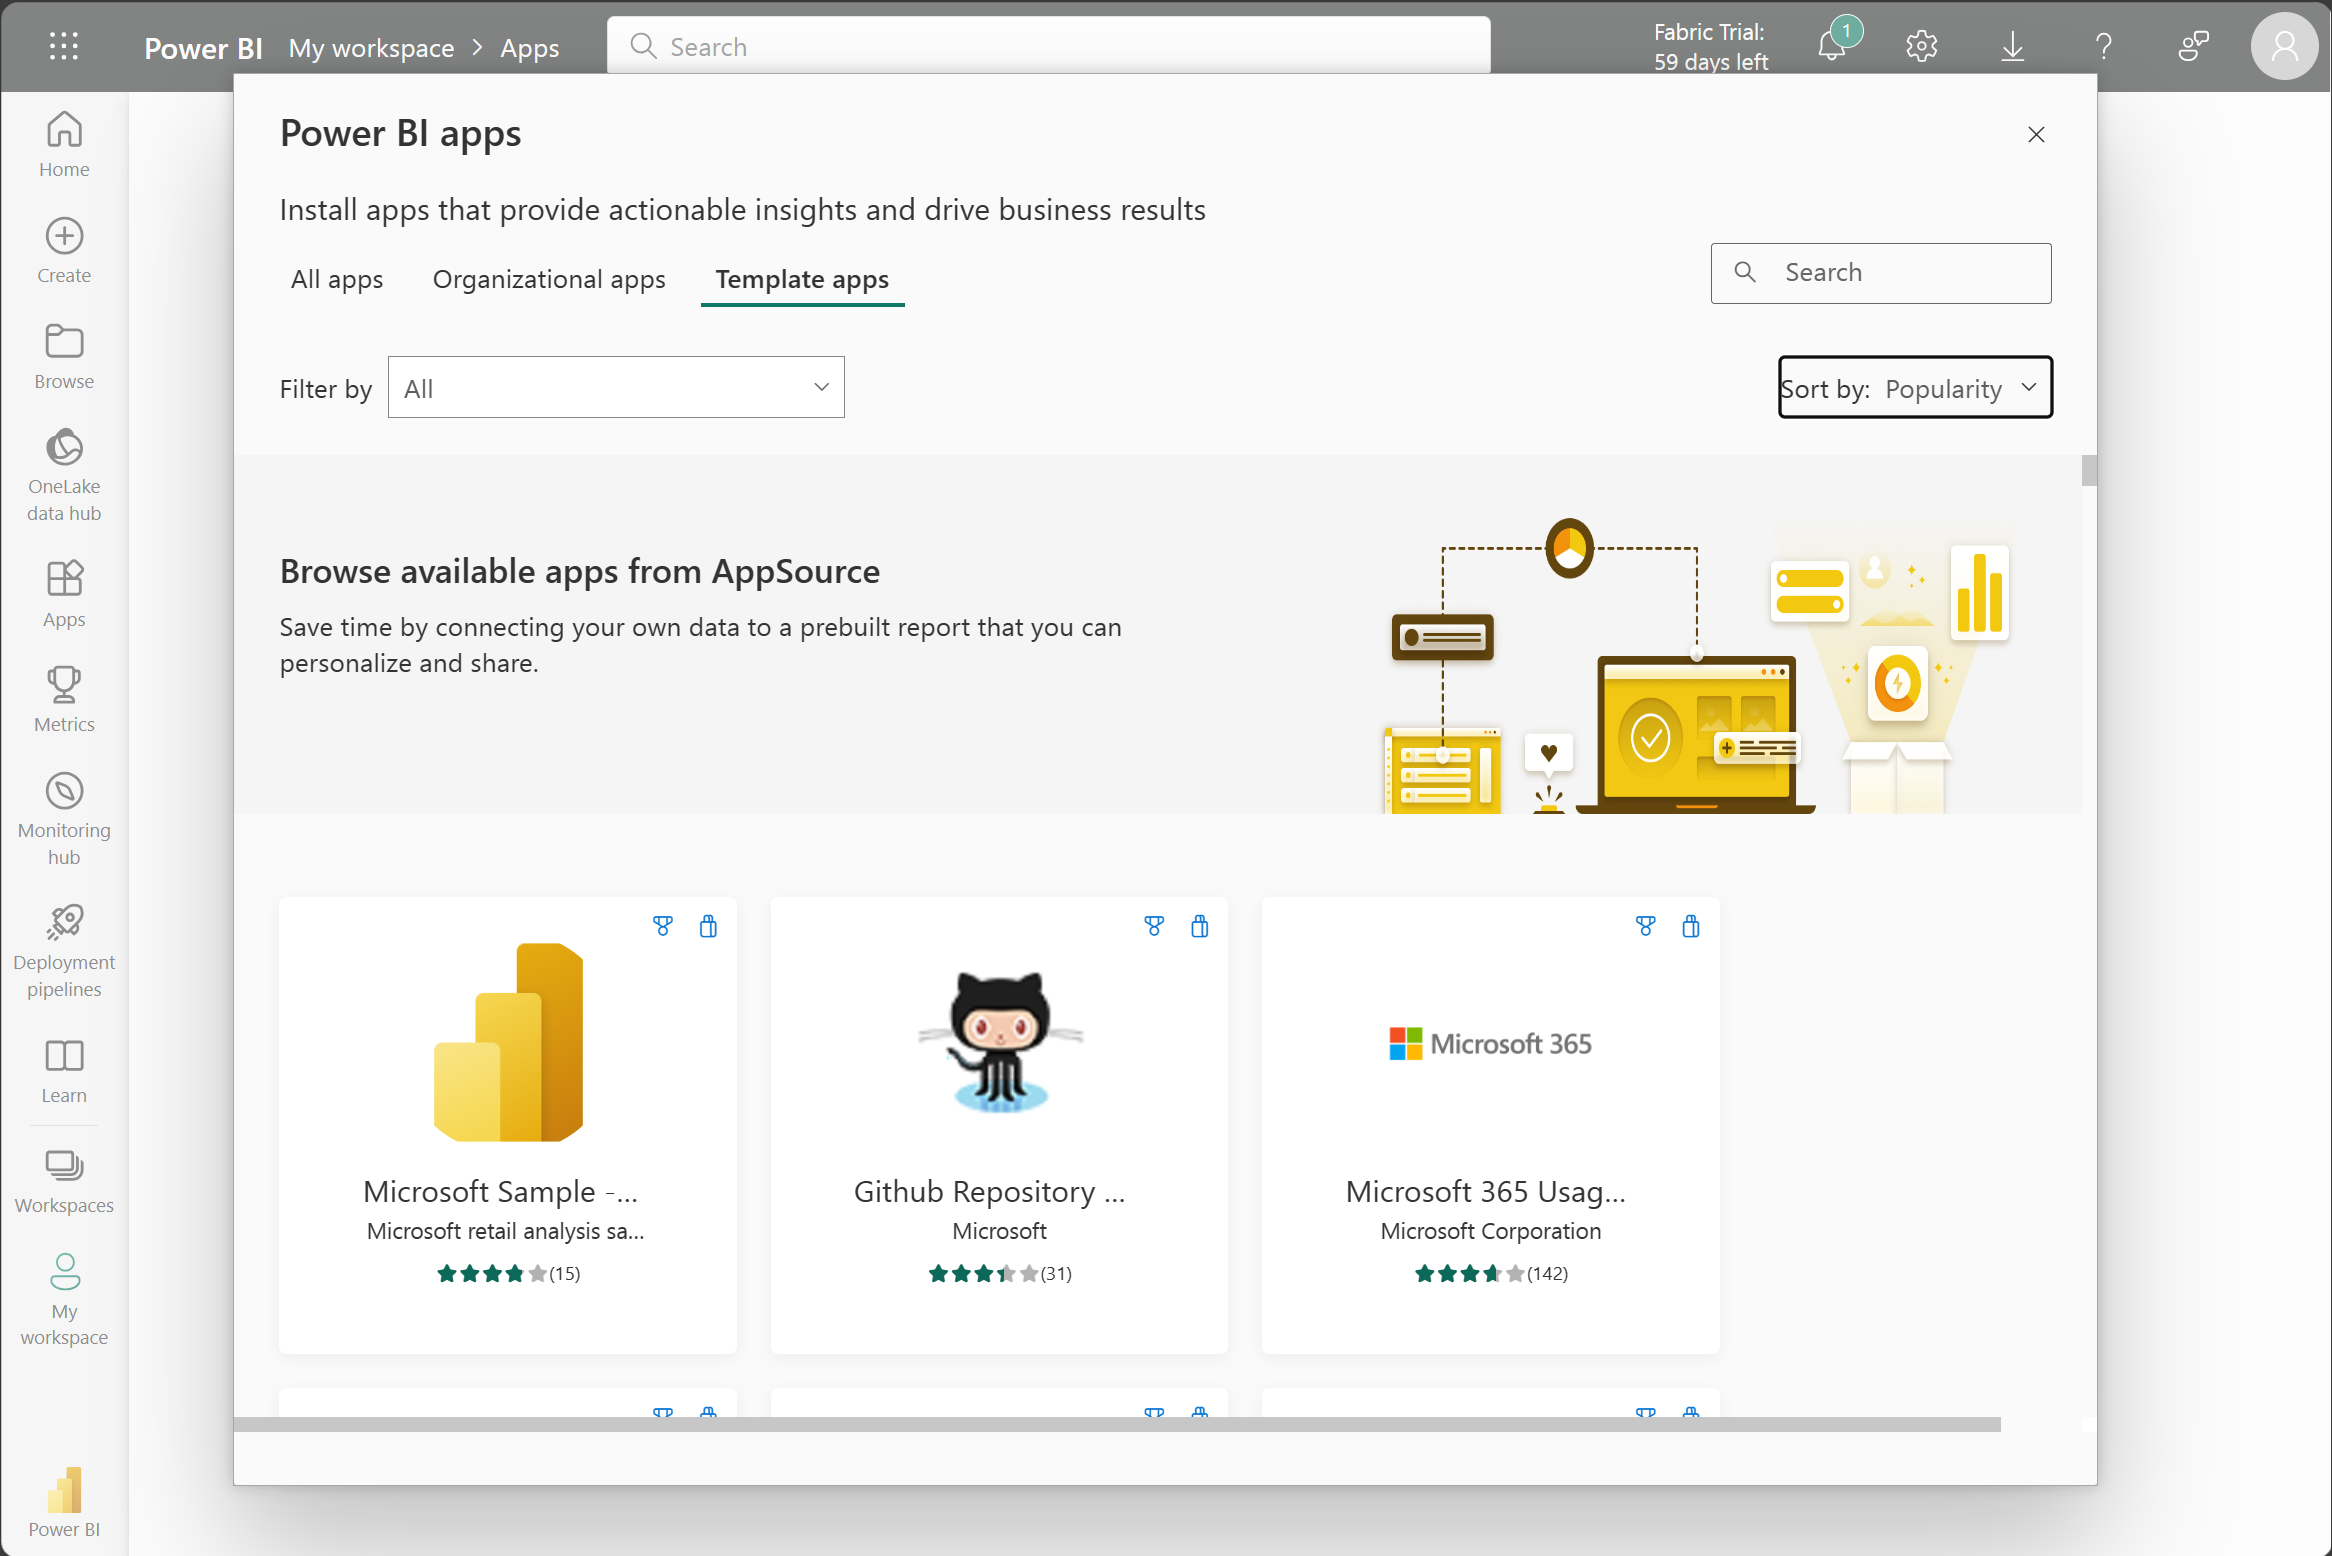
Now that you understand what an app is, let's look at template apps. Template apps allow you to find an existing app that suits your needs and then you connect your data. These apps can be a great way to quickly share insights with minimal effort.
Tip
To access template apps, select the Apps icon from the left navigation pane > Get apps > Template apps.
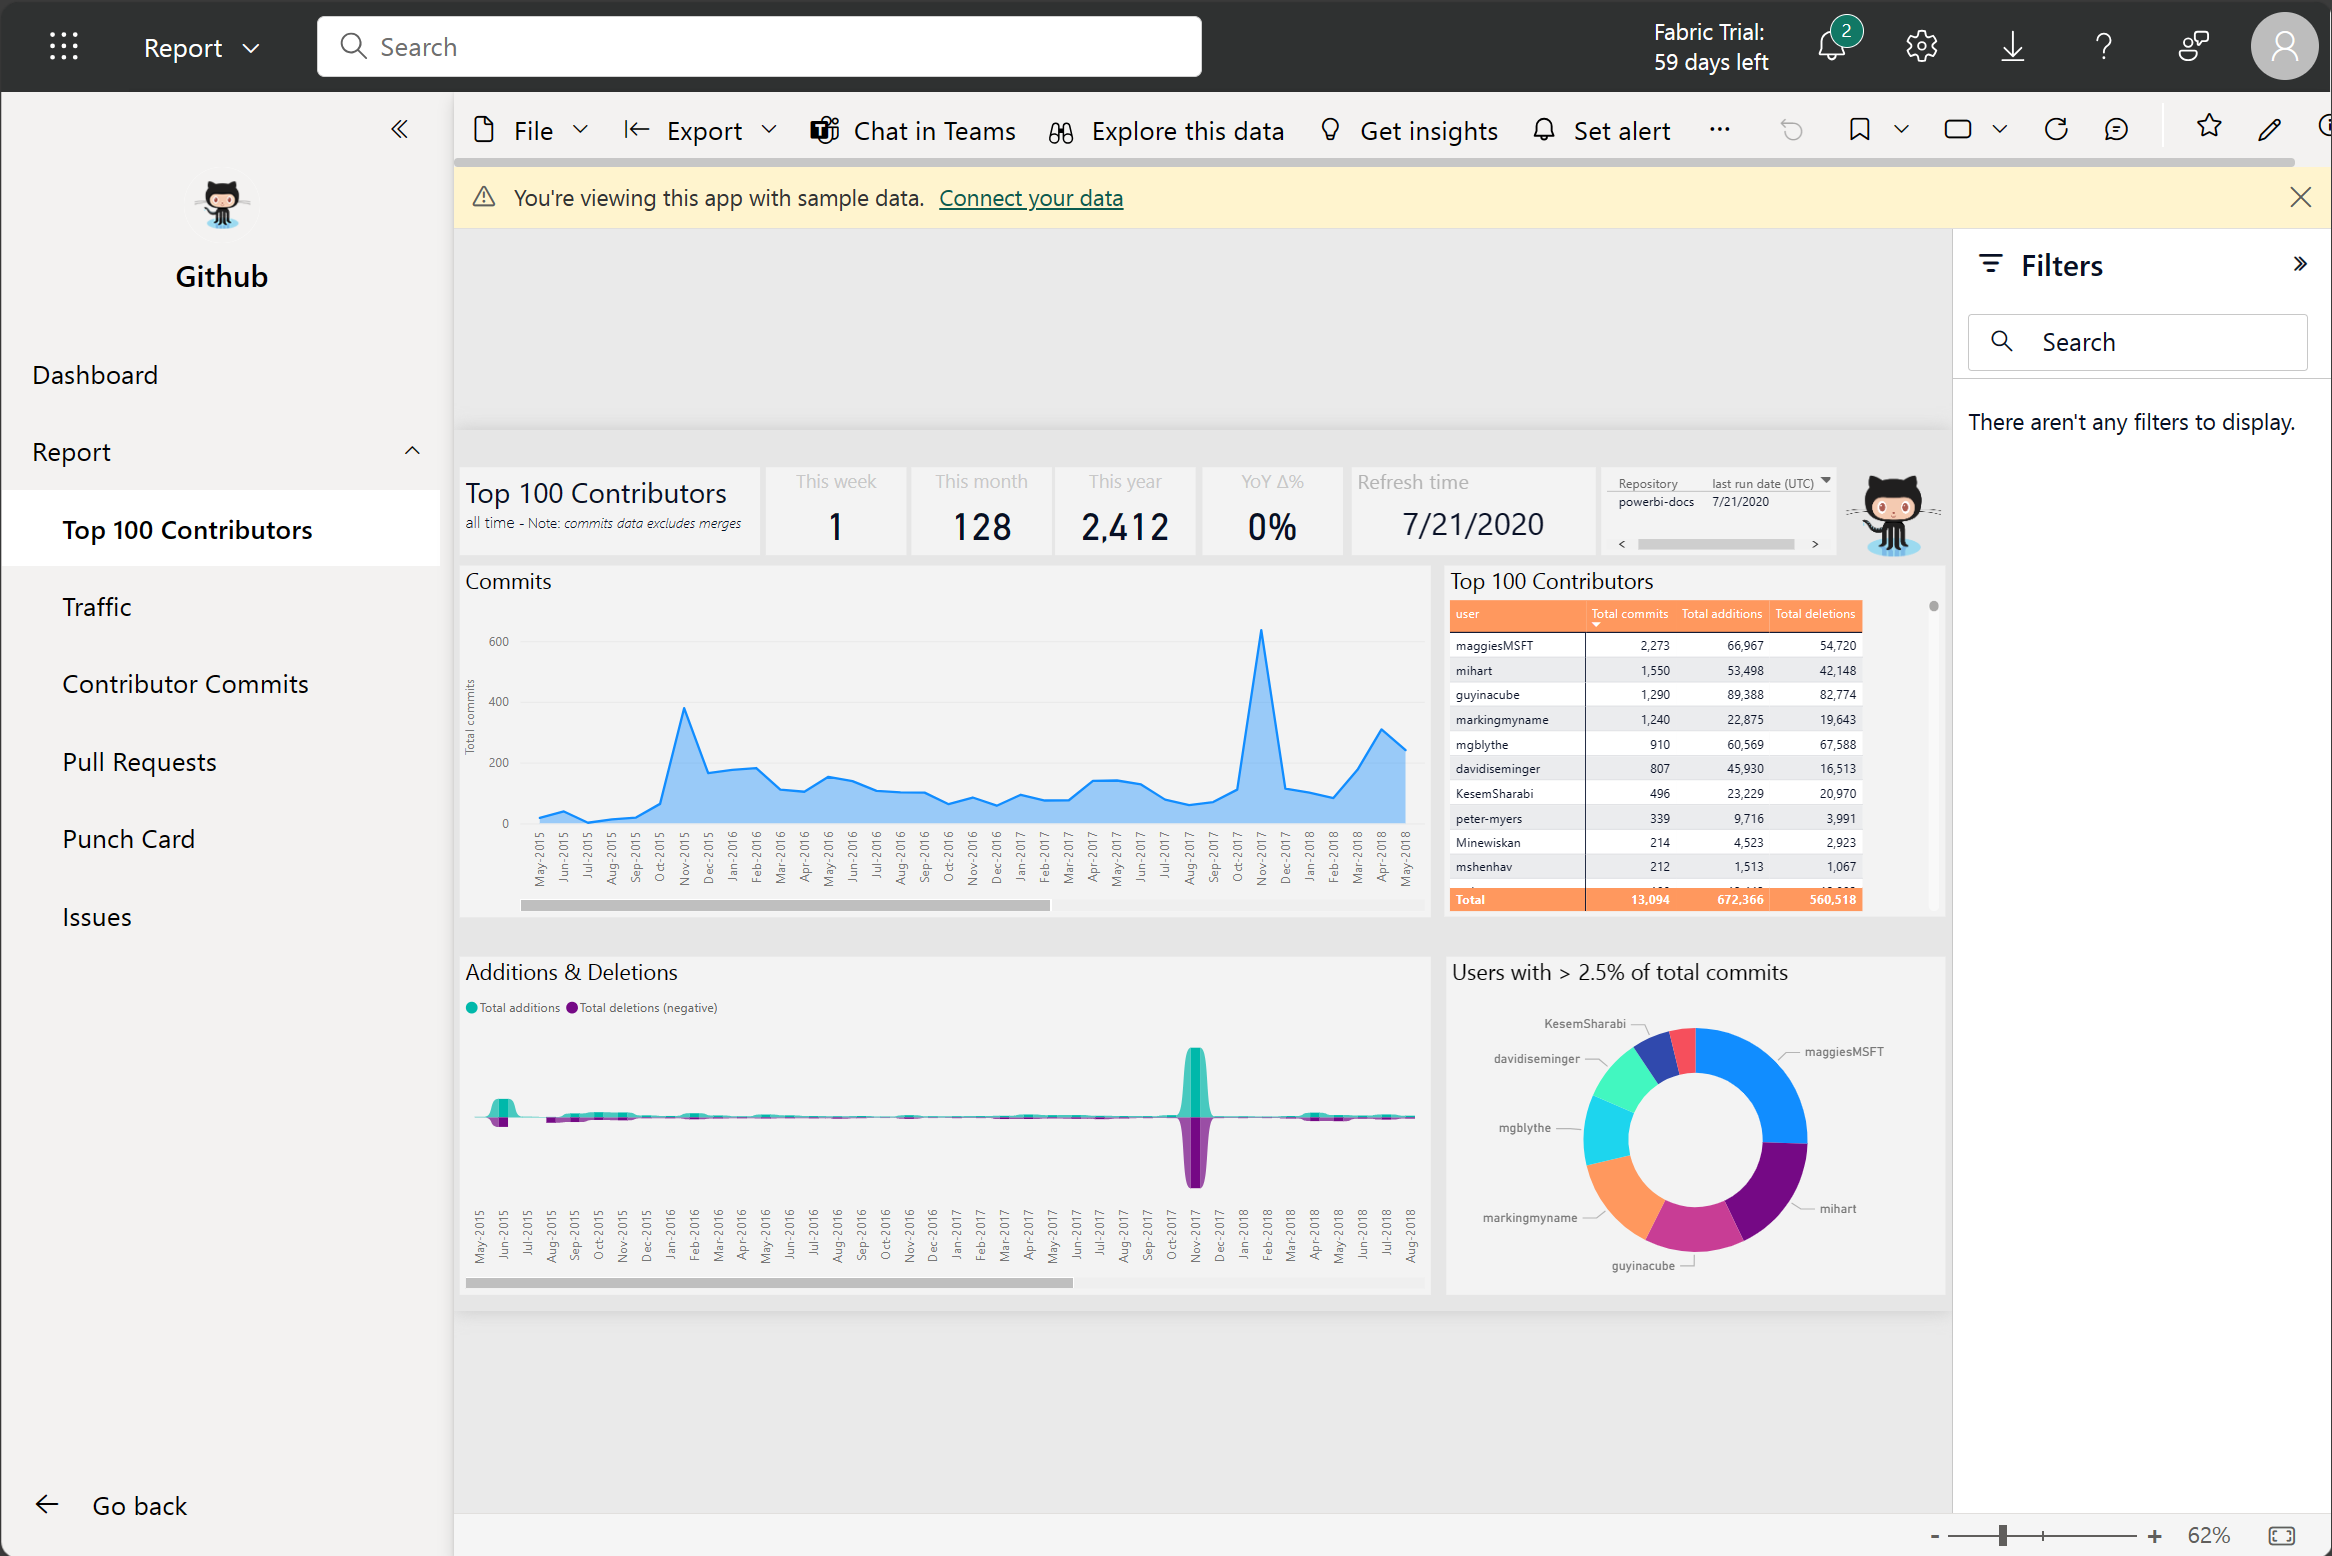
In the following screenshot, we've installed the GitHub template app and have expanded the report. We can see different report pages, including Top 100 Contributors and Pull Requests. If your organization is using GitHub, using this template app can easily support your needs without starting from the beginning.
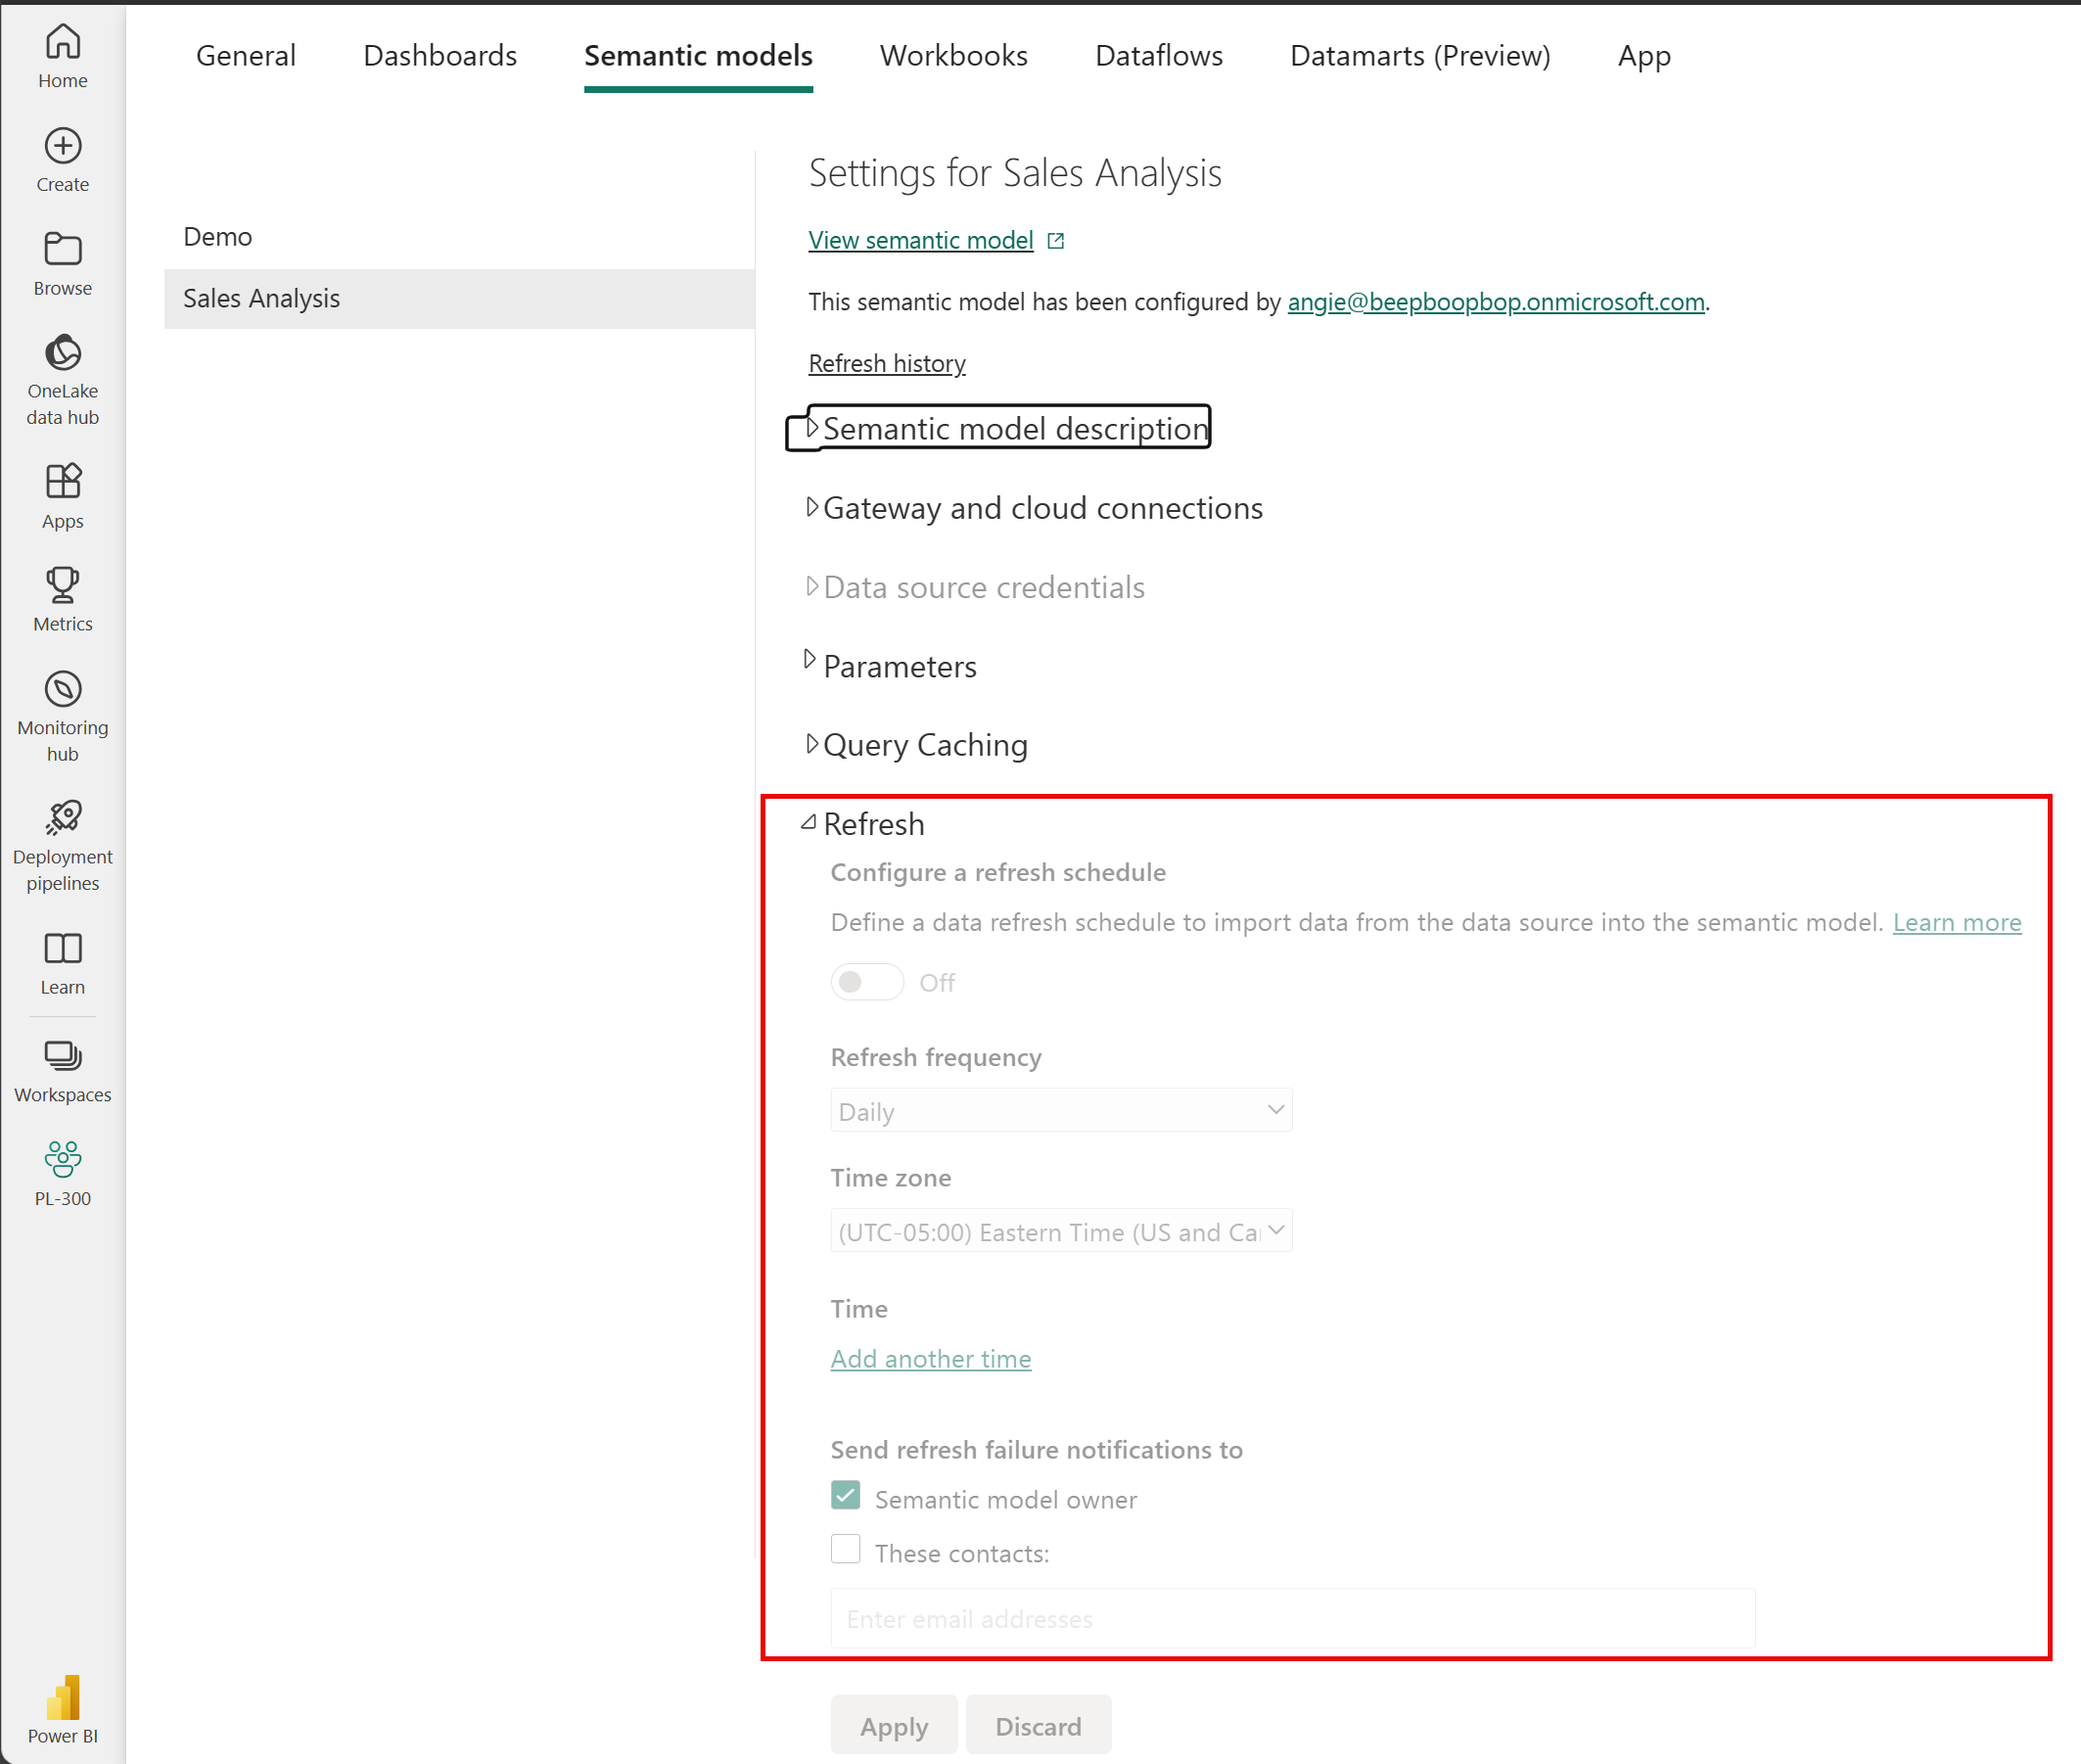
Refresh a semantic model
In order to support your ever-changing data, you can configure scheduled refreshes of your semantic models in the Power BI service. On-demand refreshes are also available.
Tip
For more information about all refresh schedules, see the Refresh data documentation.
[5] Knowledge check
[1] What is the common flow of activity in Power BI?
a. Create a report in the Power BI service, share it to Power BI mobile, and interact with it in Power BI Desktop.
b. Create a report in Power BI Desktop, share it to the Power BI service, and interact with reports in the service and Power BI Mobile.
c. Create a report in Power BI mobile, share it to Power BI Desktop, and interact with reports in the Power BI service.
[2] Which of the following are building blocks of Power BI?
a. Tiles and visualizations.
b. Semantic models and visualizations.
c. Semantic models and reports.
[3] What is a collection of reports and dashboards called in Power BI?
a. The canvas.
b. Scheduled refresh.
c. An app.
[6] Summary
Microsoft Power BI offers a complete data analytics solution that includes data preparation, visualization, and distribution. Semantic models and visualizations are the building blocks of Power BI.
The flow and components of Power BI include:
Power BI Desktop for creating semantic models and reports with visualizations.
Power BI service for creating dashboards from published reports and distributing content with apps.
Power BI Mobile for on-the-go access to the Power BI service content, designed for mobile.
By using Power BI, you can make data-informed decisions across your organization.
Source:
https://learn.microsoft.com/en-us/training/modules/get-started-with-power-bi/