Get started with Copilot in Power BI

Mohamad's interest is in Programming (Mobile, Web, Database and Machine Learning). He is studying at the Center For Artificial Intelligence Technology (CAIT), Universiti Kebangsaan Malaysia (UKM).
Copilot in Power BI increases productivity when developing semantic models and reports using Power BI. Copilot also allows you to interact with your data using natural language to gain insights.
Learning objectives
By the end of this module, you'll understand how to:
Use Copilot in Power BI during report development.
Prepare semantic models for use with AI.
Interact with data using natural language in Copilot Chat.
[1] Introduction
Copilot in Power BI is an AI-powered assistant that helps you work with data more efficiently. Data authors can use Copilot to prepare semantic models and create reports. Power BI also offers features to help authors prepare their data for use with Copilot by business users.
In this module, you learn how to use Copilot in Power BI to assist with semantic model and report development tasks. You also learn how to prepare data for your organization to interact with curated data using natural language. By the end, you'll have the knowledge to use Copilot in Power BI to make data analysis and reporting easier and more effective.
[2] Use Copilot in Power BI to prepare and model data
Power BI semantic models are the foundation for all reports and incorrectly designed semantic models might result in limited or inaccurate reports. Copilot in Power BI helps increase productivity and bridge skill gaps by assisting with data preparation, model configuration, and DAX calculations. This unit explores ways to use Copilot in Power BI Desktop to develop a semantic model.
Note
See Enable Copilot in Power BI for more information about how to use Copilot in your organization.
Prepare data in Power Query
Clean, consistent data is the foundation for accurate reporting and analysis. Copilot can help automate repetitive tasks such as resolving inconsistencies, setting data types, and applying naming conventions. Use Power Query Editor to profile, clean, and transform your data.
Profile: Assess column quality, distribution, and profile.
Clean: Address missing values, correct out-of-range or inconsistent entries, and remove duplicates.
Transform: Rename columns, set correct data types, and reshape tables as needed.
This process also helps prepare your data for use with AI, which is covered later in this module.
Configure a semantic model
Relationships allow you to filter and summarize data in report visuals later in the development process. You can use the autodetect relationships feature to get you started, then use Copilot to summarize the initial semantic model to determine if any other relationships are needed.
In the following image, there's a single fact table connected by relationships to dimension tables. Power BI reports work best when using a star or snowflake schema for the semantic model.
Copilot can summarize your semantic model and provide a high-level overview of the structure and key elements. This summary can help you understand important objects or missing relationships, for example.

Query with DAX
There are four views in Power BI Desktop: Report, Table, Model, and DAX Query. In the DAX Query view, you can select Copilot in the ribbon and use natural language to describe what you want.
Consider the following prompt total sales for all salespeople individually for all items in the accessories category entered into the Copilot feature of DAX Query view.
This prompt is intending to calculate each individual salesperson's total sales for the accessories category. At AdventureWorks, there are multiple categories with multiple products within. Accessories have low sales, and the business requirement is to understand better who is selling more accessories, in case they can share valuable information.
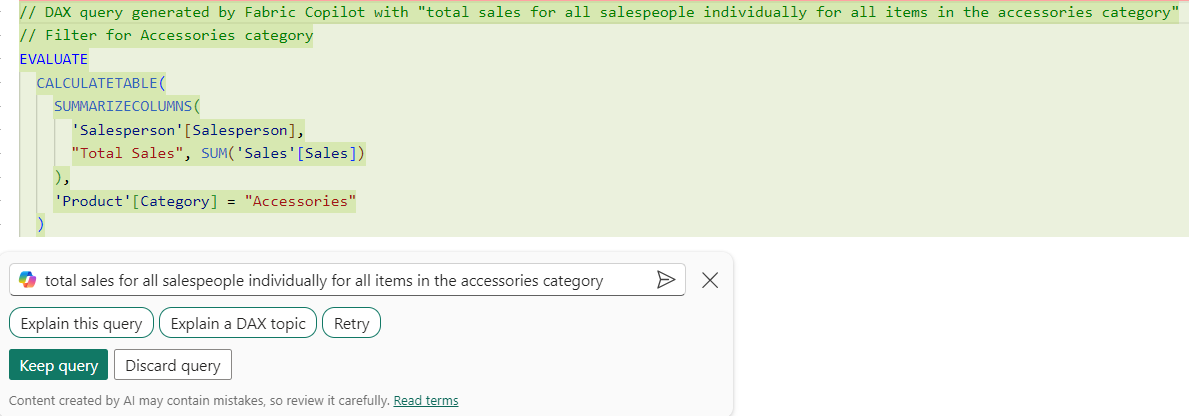
DAXCopy
// DAX query generated by Fabric Copilot with "total sales for all salespeople individually for all items in the accessories category"
// Total sales for each salesperson for items in the accessories category
EVALUATE
  SUMMARIZECOLUMNS(
    'Salesperson'[Salesperson],
    FILTER('Product', 'Product'[Category] == "Accessories"),
    "Total Sales", [Total Sales]
  )
The following table shows sample results of the Copilot-generated DAX query.
Expand table
| Salesperson | Total Sales |
| Stephen Jiang | 8374.76 |
| Michael Blythe | 38682.84 |
| Linda Mitchell | 66916.05 |
Create measures from DAX queries
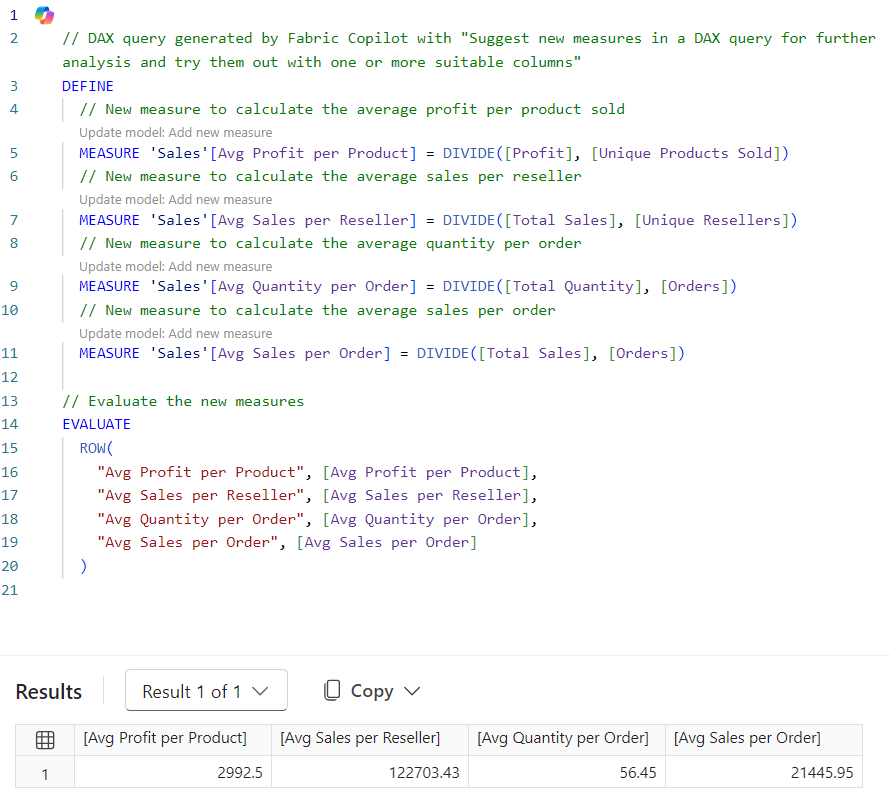
Use Copilot in DAX Query View to explore the data and determine which measures you need to create, and then select Update model with changes to create the measures. The following query was generated from a suggest measures prompt.
DAXCopy
// DAX query generated by Fabric Copilot with "Suggest new measures in a DAX query for further analysis and try them out with one or more suitable columns"
DEFINE
  // New measure to calculate the average profit per product sold
  MEASURE 'Sales'[Avg Profit per Product] = DIVIDE([Profit], [Unique Products Sold])
  // New measure to calculate the average sales per reseller
  MEASURE 'Sales'[Avg Sales per Reseller] = DIVIDE([Total Sales], [Unique Resellers])
  // New measure to calculate the average quantity per order
  MEASURE 'Sales'[Avg Quantity per Order] = DIVIDE([Total Quantity], [Orders])
  // New measure to calculate the average sales per order
  MEASURE 'Sales'[Avg Sales per Order] = DIVIDE([Total Sales], [Orders])

// Evaluate the new measures
EVALUATE
  ROW(
    "Avg Profit per Product", [Avg Profit per Product],
    "Avg Sales per Reseller", [Avg Sales per Reseller],
    "Avg Quantity per Order", [Avg Quantity per Order],
    "Avg Sales per Order", [Avg Sales per Order]
  )
And here's the resulting table:
Expand table
| Avg Profit per Product | Avg Sales per Reseller | Avg Quantity per Order | Avg Sales per Order |
| 2992.4987 | 122703.4339 | 56.44745575221239 | 21445.9541 |
The following screenshot is the result of three simple steps:
Enter the suggest measures prompt.
Select Keep query after results return.
Run the query.
As a developer, you can Update model with changes to create the measures best suited to your project.
Copilot allows you to explore, design, and enhance semantic models more efficiently, making report development more accessible for all skill levels.
[3] Create reports with Copilot in Power BI
Use Copilot in Power BI to quickly visualize information and uncover insights once your semantic model is prepared. Copilot makes it easier to create compelling, data-driven stories—even if you’re new to Power BI by generating report pages, visuals, and summaries based on your prompts,
Create reports with Copilot in Power BI
Copilot in Power BI helps you build interactive reports faster by turning your ideas into report elements with just a prompt. You can use suggested prompts or enter your own to create new report pages, suggest content, or answer specific data questions in the Copilot pane.
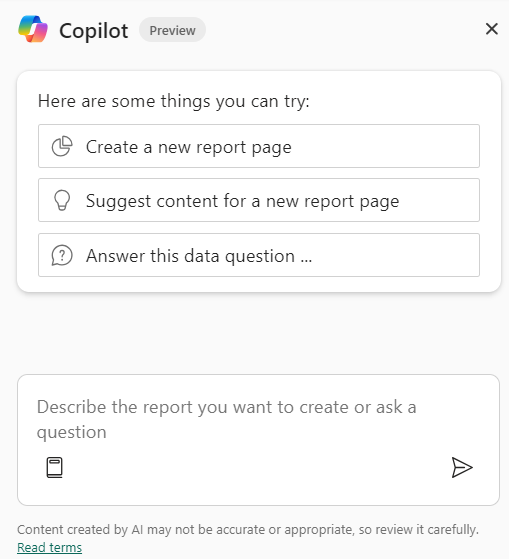
The following example was generated by using the Create a new report page suggested prompt. Copilot asked for the name and description, and then created the report elements, including:
Header with slicers for product and salesperson.
Card visuals for the sums of sales, cost, and measure for profit (sales minus cost).
Area charts evaluating sales, cost, and profit over time.
Column charts evaluating sales, cost, and profit by product.
A Map visual for sales by region.

This report and all of the elements were generated in a consistent theme and created quickly. Using Copilot saves time and helps you focus on analysis rather than manual layout and formatting.
Create reports in the Power BI service
When you create reports in Power BI Desktop and publish them, both the semantic model and the report are saved in your workspace. The semantic model contains your data, relationships, and measures, while the report is the visual layer you design.
Copilot can also help create reports based on semantic models in the Power BI service. To get started, select the ellipsis (...) next to your semantic model and choose Create report.

For this example report, we see several different possibilities offered, including:
Sales Performance by Salesperson
Regional Sales Analysis
Product Cost and Profitability
In the following screenshot, we selected the Product Cost and Profitability prompt to generate a new report page. This page has a similar layout from the one created with Power BI Desktop. There are Card visuals, Bar and Column charts, and Area charts to help analyze the cost and profitability of different products, including standard cost, profit, and profit margin.

Create pages with custom prompts
You can also provide your own prompt based on your knowledge of the data and business requirements for the report. There might be limitations to what Copilot can create based on your prompt. Some ideas for our model are:
Create a page that shows the top 10 products by sales.
Create a visual on a new page that shows the top three colors across all products sold.
Tip
For more information, see Write Copilot prompts that produce results in Power BI.
Summarize report insights with Copilot
Copilot can also help you communicate key findings by generating narrative summaries of your report data. Whether you’re preparing an executive summary or answering likely questions from leadership, Copilot’s summaries help keep your audience engaged and informed. Use the Narrative visual or Copilot pane to create summaries with suggested or custom prompts, referencing all visuals on a page or only selected ones.
Example prompts:
Give an executive summary
Answer likely questions from leadership
Create a bulleted list of insights

In the following screenshot, the Copilot-generated summary, some of the highlighted points are:
Highest and lowest sales across products.
A significant spike in sales.
Overall profit and highest profit on a single day.
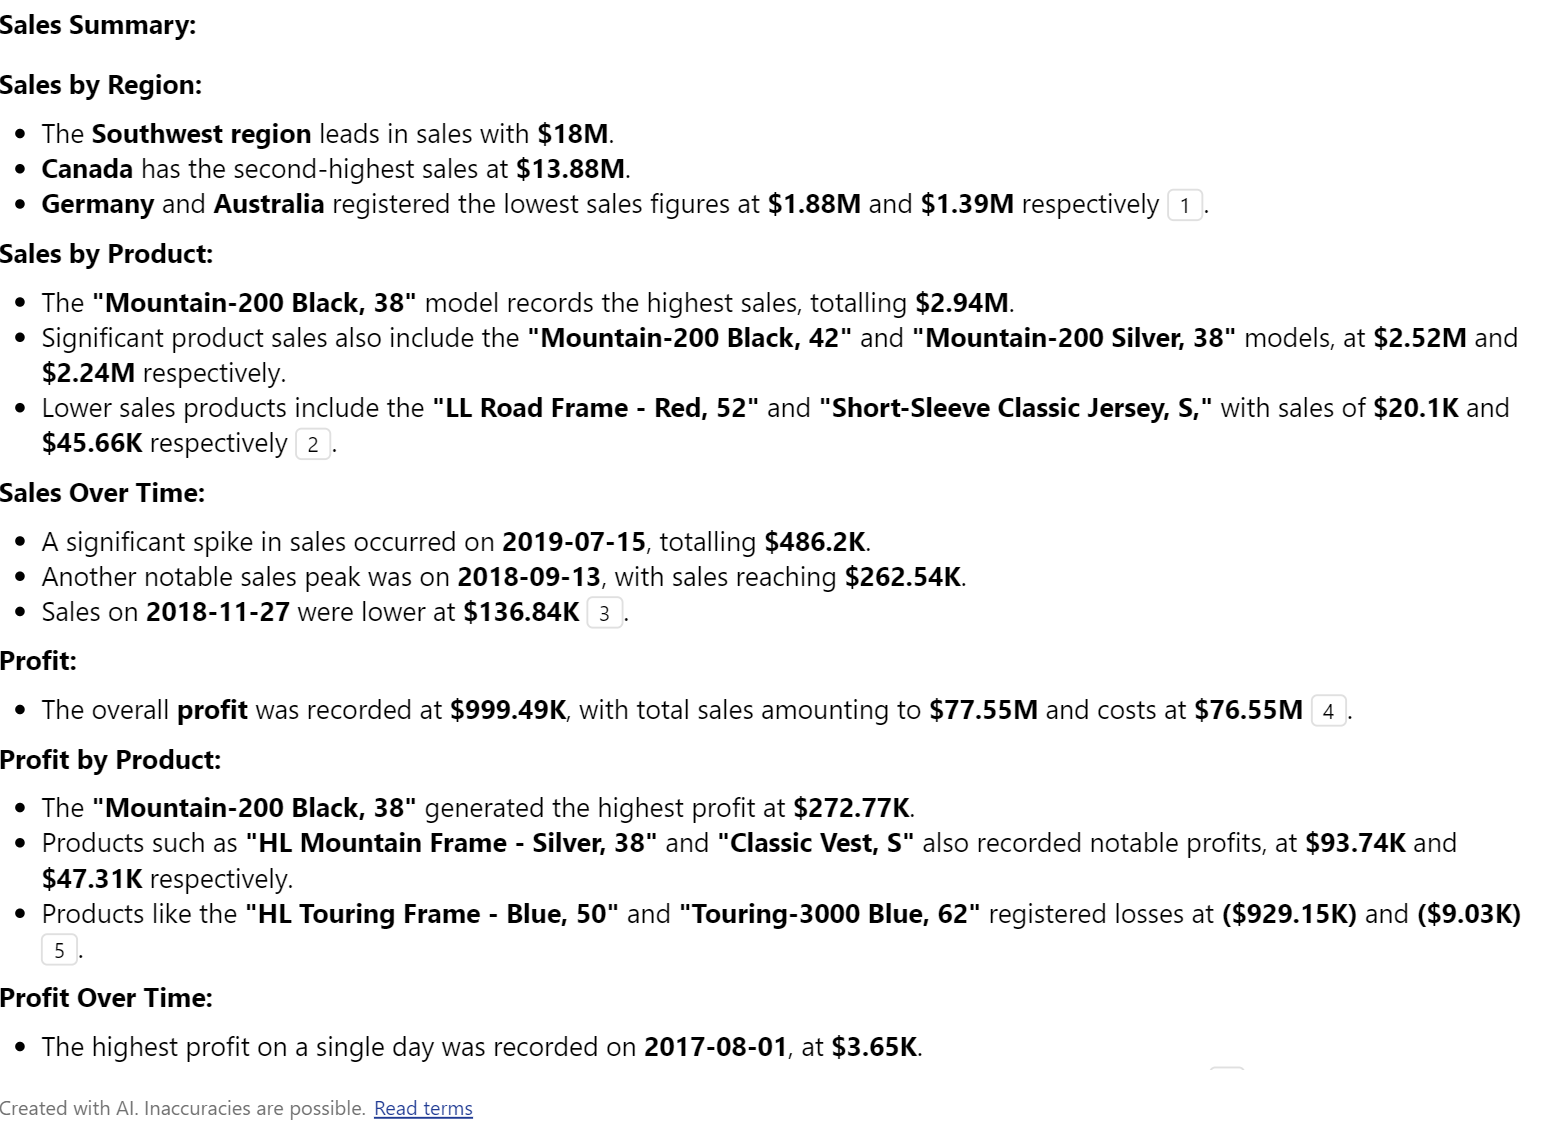
These details offer insights at a glance while the whole report offers interactive visuals for further analysis.
Tip
Review the Copilot in Power BI documentation for other prompt ideas.
Summarize in the Copilot pane
Both developers and consumers can use the Copilot pane to summarize or answer questions about the report. Copilot considers all data, including data hidden behind filters or slicers that aren't currently applied. You can specify the scope (entire report or current page) in your prompt.
Important
Copilot responses might vary and can contain errors. Treat Copilot-generated content as a first draft and always review before completing development.
[4] Get your data ready for AI usage in Power BI
Copilot in Power BI transforms how both developers and business users interact with data. Copilot streamlines the development process of preparing semantic models, building reports, and exploring data through natural language. In this unit, we discuss how to optimize your data for consumers using Copilot chat experiences.
Prepare your semantic model
Once you create your semantic model and report, you can use the Prep data for AI features to further curate the business user's experience. These features provide Copilot with the context it needs to reduce ambiguity and improve relevance and accuracy. These features are available in the Prep data for AI dialog box.
Simplify the data schema by removing unnecessary tables and columns, and using clear, descriptive names. For example, you might have objects necessary for your report that aren't relevant to business users, such as ID columns. IDs are essential for relationships, but Copilot doesn't need to use them when answering user questions.

Verified answers associate common business questions with specific visuals. For example, a visual for Total Opportunities by Sales Stage can answer many different questions for different users. When you create a verified answer, you can choose from suggested questions or create your own. When users ask that question in Copilot, your verified answer is included in the response.

Provide AI instructions with key business context and domain-specific logic to Copilot to help tailor responses. AI instructions help clarify business terms, guide analysis approaches, and provide critical data context. Once saved, these instructions are used by Copilot to respond more intelligently to user prompts. For example, tell Copilot if your industry usually sees a spike in activity on the first Friday of each month, so Copilot understands this behavior and related terms in user chats.

Test and mark the model
It's important to test your model to validate that you get expected results before marking the model as reviewed. Once you're confident that your schema is simplified, your verified answers are configured, and your AI instructions are updated, you can mark the semantic model as Prepped for AI. You can configure this property for the semantic model in the Power BI service.

Integration with Microsoft Fabric
Power BI is part of the Microsoft Fabric analytics platform. If your organization is also using Fabric, you can use Copilot to interact with Fabric data agents. Copilot in Power BI and Fabric data agents both use AI, but have different purposes. This module doesn't go into detail for Fabric data agents, but provides a link in the summary for further learning.
Copilot in Power BI is preconfigured to assist you with certain tasks, such as data cleaning to increase productivity.
Fabric data agents can be customized to include specific data and follow instructions for additional context.

By combining AI-ready semantic models with Copilot’s chat capabilities, Power BI delivers a seamless experience from data preparation to insight discovery. Developers enable AI-optimized content to allow business users to interact with data in a conversational, intuitive way.
Chat with your data
Now that your data is prepared, business users can use Copilot’s chat feature to explore and understand data. Users can quickly uncover insights, interpret answers, and dig deeper into the data. This feature is also valuable for emerging data analysts or citizen developers who might not have deep technical expertise.

In Power BI service, users simply select Copilot to chat with the data, such as:
Ask questions: Use everyday language to query your data, such as "What were our top sales regions last quarter?"
Interpret answers: Copilot provides responses with supporting visuals and explanations of how it arrived at the answer.
Summarize findings: Quickly generate summaries to share insights with others or inform decision-making.

This approach empowers everyone in the organization to make data-driven decisions, regardless of their technical background.
Note
For more information including considerations and limitations, see the Prepare your data for AI documentation.
[5] Module assessment
Check your knowledge
[1] What is the role of Power Query in the preparation of a semantic model for Power BI report?
a. Power Query is used to enable Copilot in Power BI.
b. Power Query is used to profile, clean, and transform data to ensure its quality for the semantic model.
c. Power Query is used to publish the report on Power BI service.
[2] What is the purpose of creating relationships between tables in Power BI?
a. To filter and summarize data in report visuals.
b. To create a more visually appealing data model.
c. To reduce the amount of data stored in each table.
[3] What is the primary function of Power BI Desktop in report development?
a. It is used to connect to, transform, model, and visualize data.
b. It is used to enable Copilot for report creation.
c. It is used to publish reports for collaboration and distribution.
[4] What is the purpose of the Narrative visual in Power BI?
a. It allows you to create interactive visuals for data analysis.
b. It allows you to create a custom visual that summarizes and references data within your report visuals.
c. It is used to hide data behind filters or slicers that aren't currently applied.
[6] Summary
In this module, you learned about the importance of well-designed semantic models in Power BI to create effective reports. You explored how Copilot in Power BI can aid your report development process and increase productivity for all users.
You also discovered how to further prepare your data so that business users can use Copilot chat to generate insights with natural language. By using Copilot, your organization can make faster, more confident data-informed decisions.
Learn more:
Source:
https://learn.microsoft.com/en-us/training/modules/power-bi-copilot/