Data Analysis Using Power BI
Mohamad's interest is in Programming (Mobile, Web, Database and Machine Learning). He is studying at the Center For Artificial Intelligence Technology (CAIT), Universiti Kebangsaan Malaysia (UKM).
QUESTION 1
You build a report to help the sales team understand its performance and the drivers of sales. The team needs to have a single visualization to identify which factors affect success.
Which type of visualization do you think is the most suitable for this purpose?
Ⓐ Key influencers
Ⓑ Line and clustered column chart
Ⓒ Q&A
Ⓓ Funnel chart
QUESTION 2
You need to create a Power BI visual as shown in the following exhibit.
The indicator color for Total Sales will be based on % Growth to Last Year. The solution must use the existing calculations only.
How should you configure the visual?
Conditional formatting:
Ⓐ Background colors
Ⓑ Data bars
Ⓒ Font color
Ⓓ Icons
Ⓔ Web URL

Format by:
Ⓐ Color scale
Ⓑ Field value
Ⓒ Rules
QUESTION 3
You plan to create the chart shown in the following exhibit.
How should you create the dashed horizontal line denoting the 40th percentile of daily sales for the period shown?
Ⓐ Add a measure to the visual
that uses the following DAX
expression.
Measure1 = PERCENTILEX.INC (Sales,sales[Total Sales],0.40)

Ⓑ Add a measure to the visual
that uses the following DAX expression.
Measure1 = PERCENTILEX.EXC (Sales,sales[Total Sales],0.40)

Ⓒ Add a new percentile line that
uses Total Sales as the measure
and 40% as the percentile.

Ⓓ Create a horizontal line
that has a fixed value of 24,000.
QUESTION 4
You have a report that contains a donut chart and a clustered column chart.
Interactions between the visuals use the default settings.
You need to modify the report so that when you select a column in the column chart, the donut chart redraws by using the data from the selected column.
What should you do?
Ⓐ Select the donut chart and
set the column chart interaction
to Filter.

Ⓑ Select the column chart and
set the donut chart interaction
to Filter.

Ⓒ Select the donut chart and
set the column chart interaction
to None.

Ⓓ Select the column chart and
set the donut chart interaction
to None.
QUESTION 5
You have a report page that contains the visuals shown in the following exhibit.
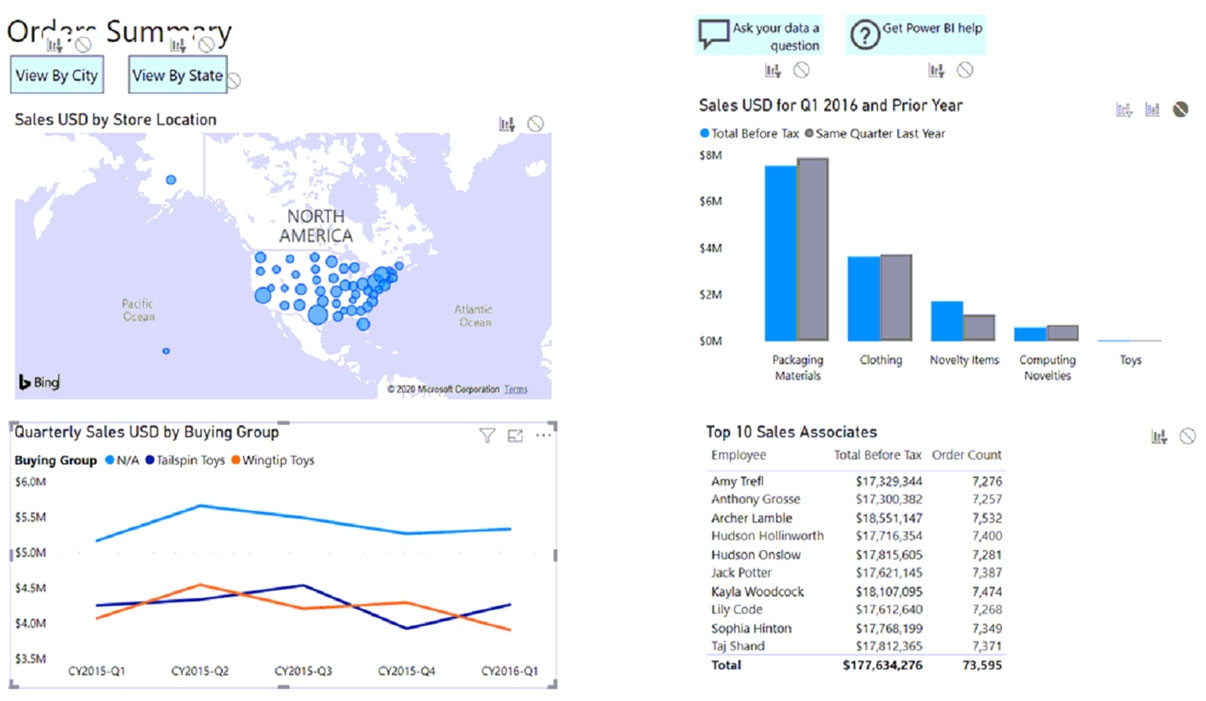
Select the answer choice that completes each statement below based on the information presented in the graphic.
⑴ Selecting a quarter on the
line chart will ____ the
clustered column chart.
Ⓐ cross-filter
Ⓑ cross-highlight
Ⓒ not affect

⑵ Selecting a data point on the
Tailspin Toys line on the line
chart will ____ the map.
Ⓐ cross-filter
Ⓑ cross-highlight
Ⓒ not affect
QUESTION 6
You are profiling data by using Power Query Editor.
You have a table that contains a column named column1. Column statistics and Value distribution for column1 are shown in the following exhibit.


Select the answer choice that completes each statement based on the information presented in the graphic.
⑴ There ____ only once.
Ⓐ are 20 values that occur
Ⓑ are 365 values that occur
Ⓒ are 277,229 values that occur
Ⓓ is one value that occurs

⑵ The Pear, Flowering species
is found more often in column1
than the ____ species.
Ⓐ Ash, Green
Ⓑ Crabapple, Flowering
Ⓒ Elm, American
Ⓓ Spruce, Blue
QUESTION 7
You have a line chart that shows the number of employees in a department over time.
You need to see the total salary costs of the employees when you hover over a data point.
What should you do?
Ⓐ Add salary to the drillthrough
fields.

Ⓑ Add salary to the visual
filters.

Ⓒ Add salary to the tooltips.
QUESTION 8

You are creating a query to be used as a Country dimension in a star schema.
A snapshot of the source data is shown in the following table.
| Country | City |
| USA | Seattle |
| USA | New York |
| USA | Denver |
| UK | Manchester |
| UK | London |
| Japan | Tokyo |
| Brazil | Rio |
| Brazil | Sao Paulo |
You need to create the dimension. The dimension must contain a list of unique countries.
Which two actions should you perform? Each correct answer presents part of the solution.
Ⓐ Delete the Country column.

Ⓑ Remove duplicates from the
table.

Ⓒ Remove duplicates from the
City column.

Ⓓ Delete the City column.

Ⓔ Remove duplicates from the
Country column.
QUESTION 9
From Power Query Editor, you attempt to execute a query and receive the following error message.
Datasource.Error: Could not find file.
What are two possible causes of the error? Each correct answer presents a complete solution.
Ⓐ You do not have permissions
to the file.

Ⓑ An incorrect privacy level
was used for the data source.

Ⓒ The file is locked.

Ⓓ The referenced file was moved
to a new location.
QUESTION 10
You receive annual sales data that must be included in Power BI reports.
From Power Query Editor, you connect to the Microsoft Excel source shown in the following illustration.
| Month | MonthNumber | 2019 | 2020 | 2021 |
| Jan | 1 | 345 | 5526 | 3456 |
| Feb | 2 | 758 | 773 | 0 |
| Mar | 3 | 37763 | 570 | null |
| Apr | 4 | 8364 | 9417 | null |
| May | 5 | 58256 | 276 | null |
| June | 6 | 6722 | 235 | null |
| July | 7 | 55225 | 6297 | null |
| Aug | 8 | 673 | 63 | null |
| Sep | 9 | 552 | 357 | null |
| Oct | 10 | 7838 | 24214 | null |
| Nov | 11 | 83544 | 257 | null |
| Dec | 12 | 32455 | 389 | null |
You need to create a report that meets the following requirements:
• Visualizes the Sales value over a period of years and months
• Adds a slicer for the month
• Adds a slicer for the year
Which three actions should you perform in sequence?
Ⓐ Select 2019, 2020, and 2021
columns.

Ⓑ Select unpivot other columns.

Ⓒ Rename the Attribute column
as Year and the Value column
as Sales.

Ⓓ Select the Month and
MonthNumber columns.

Ⓔ Select Transpose.
QUESTION 11

You have a Microsoft Excel file in a Microsoft OneDrive folder.
The file must be imported to a Power BI dataset.
You need to ensure that the dataset can be refreshed in powerbi.com.
Which two connectors can you use to connect to the file?
Each correct answer presents a complete solution.
Ⓐ Excel Workbook
Ⓑ Text/CSV
Ⓒ Folder
Ⓓ SharePoint folder
Ⓔ Web
QUESTION 12

You plan to create Power BI dataset to analyze attendance at a school. Data will come from two separate views named View1 and View2 in an Azure SQL database.
View1 contains the columns shown in the following table.
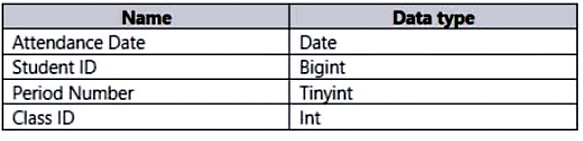
View2 contains the columns shown in the following table.
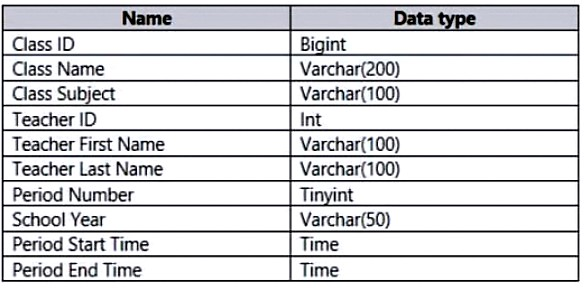
The views can be related based on the Class ID column.
Class ID is the unique identifier for the specified class, period, teacher, and school year. For example, the same class can be taught by the same teacher during two different periods, but the class will have a different class ID.
You need to design a star schema data model by using the data in both views. The solution must facilitate the following analysis:
The count of classes that occur by period.
The count of students in attendance by period by day.
The average number of students attending a class each month
In which table should you include the Teacher First Name and Period Number fields? Select the appropriate options in the answer area.
⑴ Teacher First Name:
Ⓐ Attendance fact
Ⓑ Class dimension
Ⓒ Teacher dimension
Ⓓ Teacher fact

⑵ Period Number:
Ⓐ Attendance fact
Ⓑ Class dimension
Ⓒ Teacher dimension
Ⓓ Teacher fact
QUESTION 13
You are preparing a financial report in Power BI.
You connect to the data stored in a Microsoft Excel spreadsheet by using Power Query Editor as shown in the following exhibit.
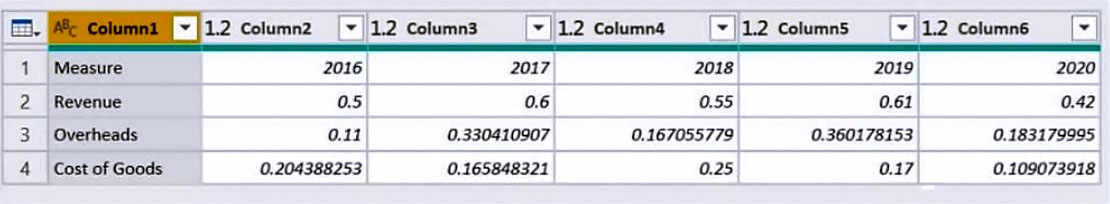
You need to prepare the data to support the following:
✑ Visualizations that include all measures in the data over time
✑ Year-over-year calculations for all the measures
Which four actions should you perform in sequence?
QUESTION 14
You have a custom connector that returns ID, From, To, Subject, Body, and Has Attachments for every email sent during the past year. More than 10 million records are returned.
You build a report analyzing the internal networks of employees based on whom they send emails to.
You need to prevent report recipients from reading the analyzed emails. The solution must minimize the model size.
What should you do?
A. From Model view, set the Subject and Body columns to Hidden.
B. Remove the Subject and Body columns during the import.
C. Implement row-level security (RLS) so that the report recipients can only see results based on the emails they sent.
QUESTION 15
You are creating a report in Power BI Desktop.
You load a data extract that includes a free text field named coll.
You need to analyze the frequency distribution of the string lengths in col1. The solution must not affect the size of the model.
What should you do?
A. In the report, add a DAX calculated column that calculates the length of col1
B. In the report, add a DAX function that calculates the average length of col1
C. From Power Query Editor, add a column that calculates the length of col1
D. From Power Query Editor, change the distribution for the Column profile to group by length for col1
QUESTION 16
You have a dataset named Pencils that contains the following columns:
[1] Unit Price
[2] Quantity Ordered
You need to create a visualization that shows the relationship between Unit Price and Quantity Ordered. The solution must highlight orders that have a similar unit price and ordered quantity.
Which type of visualization and which feature should you use?
Select the appropriate options in the answer area.
NOTE: Each correct selection is worth one point.
[1] Visualization:
(a) A column chart of Quantity
 Ordered and Unit Price by
year
(b) A line chart of Quantity
Ordered and Unit Price by item
(c) A scatter plot of Quantity
 Ordered and Unit Price by
item

[2] Feature:
(a) Automatically find
clusters
(b) Explain the decrease
(c) Find where the
distribution is different
.
QUESTION 17
You have a Microsoft Power BI data model that contains three tables named Orders, Date, and City. There is a one-to-many relationship between Date and
Orders and between City and Orders.
The model contains two row-level security (RLS) roles named Role1 and Role2. Role1 contains the following filter.
City[State Province] = "Kentucky"
Role2 contains the following filter.
Date[Calendar Year] = 2020 -
If a user is a member of both Role1 and Role2, what data will they see in a report that uses the model?
A. The user will see data for which the State Province value is Kentucky or where the Calendar Year is 2020.
B. The user will receive an error and will not be able to see the data in the report.
C. The user will only see data for which the State Province value is Kentucky.
D. The user will only see data for which the State Province value is Kentucky and the Calendar Year is 2020
QUESTION 18
You have a Power BI data model that contains a table named Employees. The table has the following columns:
• Employee Name
• Email Address
• Start Date
• Job Title
You are implementing dynamic row-level security (RLS).
You need to create a table filter to meet the following requirements:
• Users must see only their own employee data.
• The DAX expression must work in both Power BI Desktop and the Power BI service.
Which expression should you use?
Ⓐ [Email Address] - USERNAME()
Ⓑ [Employee Name] - USERPRINCIPALNAME()
Ⓒ [Employee Name] = USERNAME()
Ⓓ [Email Address] = USERPRINCIPALNAME()