K-Means Clustering for N-Dimensional Feature Spaces
Published
•2 min readM
Mohamad's interest is in Programming (Mobile, Web, Database and Machine Learning). He is studying at the Center For Artificial Intelligence Technology (CAIT), Universiti Kebangsaan Malaysia (UKM).
import numpy as np
import matplotlib.pyplot as plt
def kmeans(data, k, max_iter=100):
# Randomly initialize centroids
np.random.seed(0) # For reproducibility
centroids = data[np.random.choice(data.shape[0], k, replace=False)]
for _ in range(max_iter):
# Assignment step
distances = np.linalg.norm(data[:, np.newaxis] - centroids, axis=2)
clusters = np.argmin(distances, axis=1)
# Update step
new_centroids = np.array([data[clusters == i].mean(axis=0) for i in range(k)])
# Check for convergence
if np.all(centroids == new_centroids):
break
centroids = new_centroids
return centroids, clusters
def plot_clusters(data, centroids, clusters, title):
plt.figure(figsize=(8, 6))
if data.shape[1] == 1:
plt.scatter(data, np.zeros_like(data), c=clusters, cmap='viridis', s=100)
plt.scatter(centroids, np.zeros_like(centroids), color='red', marker='X', s=200, label='Centroids')
plt.title(title)
plt.xlabel('Feature 1')
plt.yticks([])
elif data.shape[1] == 2:
plt.scatter(data[:, 0], data[:, 1], c=clusters, cmap='viridis', s=100)
plt.scatter(centroids[:, 0], centroids[:, 1], color='red', marker='X', s=200, label='Centroids')
plt.title(title)
plt.xlabel('Feature 1')
plt.ylabel('Feature 2')
elif data.shape[1] == 3:
ax = plt.axes(projection='3d')
ax.scatter(data[:, 0], data[:, 1], data[:, 2], c=clusters, cmap='viridis', s=100)
ax.scatter(centroids[:, 0], centroids[:, 1], centroids[:, 2], color='red', marker='X', s=200, label='Centroids')
ax.set_title(title)
ax.set_xlabel('Feature 1')
ax.set_ylabel('Feature 2')
ax.set_zlabel('Feature 3')
plt.legend()
plt.show()
if __name__ == "__main__":
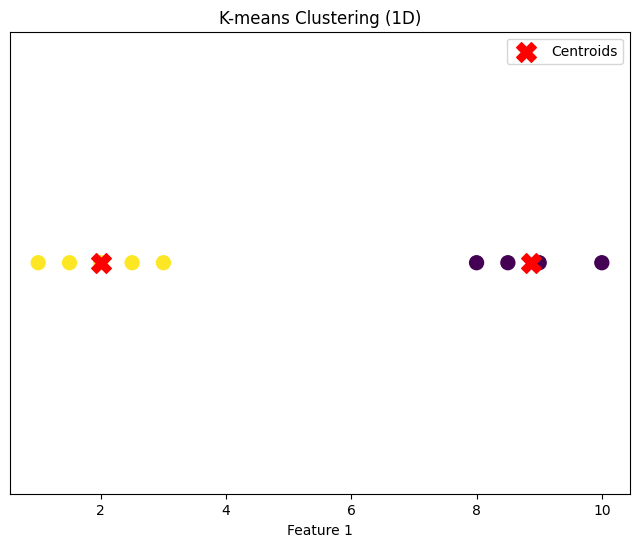
# Dataset 1: 1D
data_1d = np.array([[1], [1.5], [2], [2.5], [3], [8], [8.5], [9], [10]])
k1 = 2
centroids_1d, clusters_1d = kmeans(data_1d, k1)
plot_clusters(data_1d, centroids_1d, clusters_1d, "K-means Clustering (1D)")
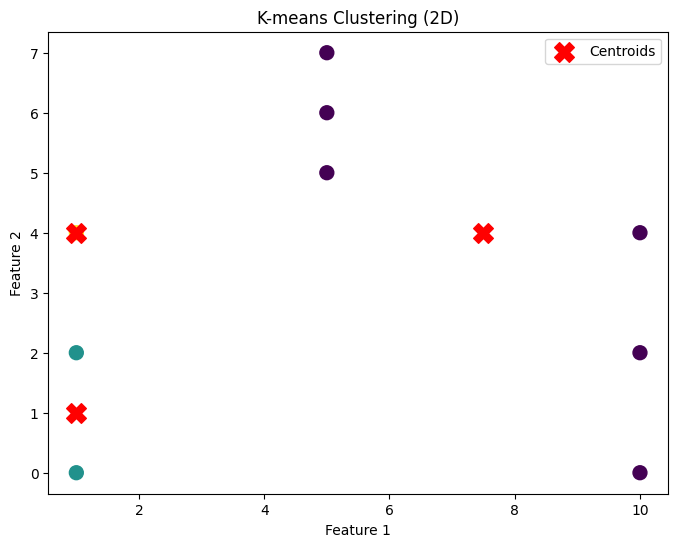
# Dataset 2: 2D
data_2d = np.array([[1, 2], [1, 4], [1, 0],
[10, 2], [10, 4], [10, 0],
[5, 5], [5, 6], [5, 7]])
k2 = 3
centroids_2d, clusters_2d = kmeans(data_2d, k2)
plot_clusters(data_2d, centroids_2d, clusters_2d, "K-means Clustering (2D)")
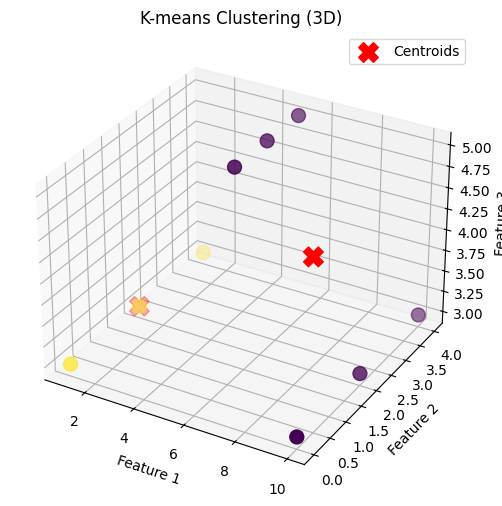
# Dataset 3: 3D
data_3d = np.array([[1, 2, 3], [1, 4, 3], [1, 0, 3],
[10, 2, 3], [10, 4, 3], [10, 0, 3],
[5, 2, 5], [5, 3, 5], [5, 4, 5]])
k3 = 2
centroids_3d, clusters_3d = kmeans(data_3d, k3)
plot_clusters(data_3d, centroids_3d, clusters_3d, "K-means Clustering (3D)")
Output:
1 Dimension
2 Dimension
3 Dimension
2 views