Power BI 103: Simple Report

Mohamad's interest is in Programming (Mobile, Web, Database and Machine Learning). He is studying at the Center For Artificial Intelligence Technology (CAIT), Universiti Kebangsaan Malaysia (UKM).
Get and Load Data
There are principally two ways to load data into Power BI. The first way is to click the Get Data button from the menu and decide what type of data you want to import. Power BI supports a variety of data types, from Excel workbooks to SharePoint files, and can even connect to databases.
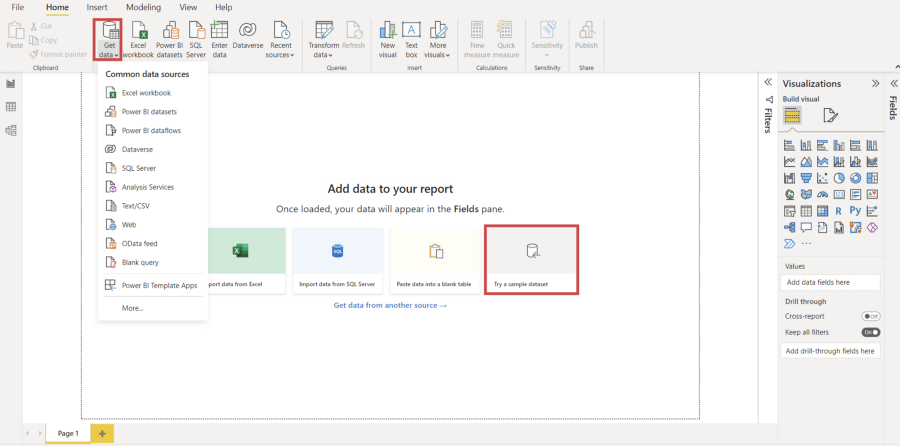
If you don’t have any datasets to play around with yet, you can also try a sample dataset, which can be accessed in the section highlighted in the red box located in the center.
In this tutorial, we will download one of the samples available from Power BI, called the Financial data sample workbook. Once you have downloaded it, you only need to use the Get Data button and select the option Excel workbook. After that, you select the table named financials and press the Load button.
Once you have loaded the table, you can check it out by pressing on the “Data View” as seen in the gif below. You will notice that Power BI’s data view interface is very similar to Excel’s user interface. Moreover, there are similar operations you can apply, such as renaming, adding and deleting columns, filtering data, replacing values of a column, and more. For example, we can filter the column Country to remove the United States. There is also the possibility to sort the column in ascending or descending order.
Build a Report
Now that the data is loaded into Power BI, we can build a simple report. To build a report, you can go to the report view highlighted in the gif below.
In this pane, you can see the name of the table and its corresponding columns on the right-hand side. In this example, we’re visualizing some data related to the Sales and Country fields. To do so, you can select the two fields, and choose from the different types of visualizations available in the visualizations pane. You can also visualize groupings of data, such as “Sales by Country”.